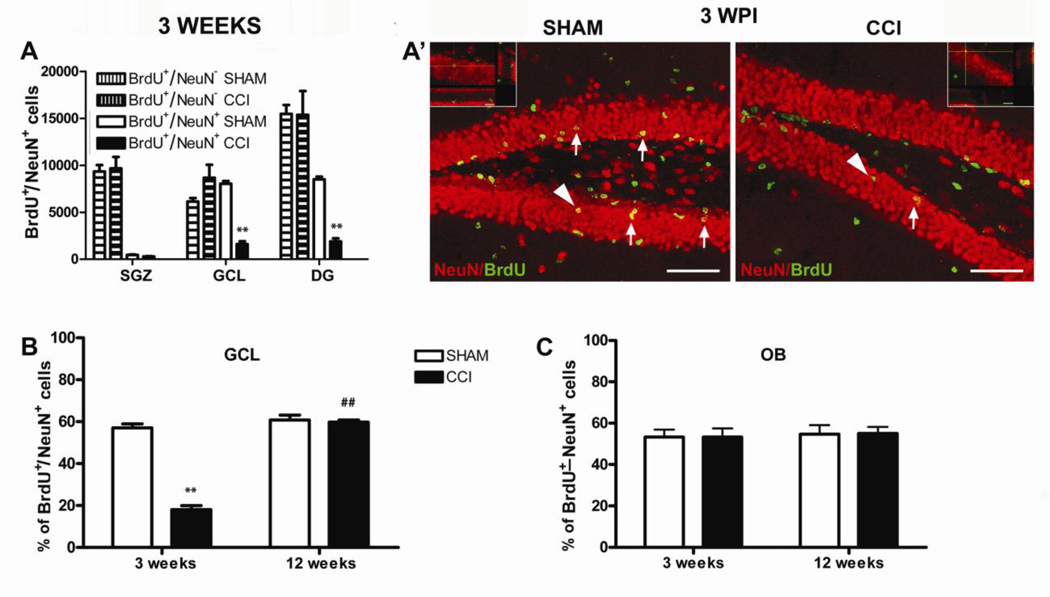
Figure 3.
Analysis of adult neurogenesis in the hippocampus and olfactory bulbs 3 and 12 weeks after injury. A, The number of BrdU+ cells was similar between CCI and sham mice but the number of BrdU+/NeuN+ cells were dramatically reduced in the GCL of CCI mice compared to shams. Mean ± SEM of: BrdU+ (BrdU+/NeuN + BrdU+/NeuN+ cells) and BrdU+/NeuN+ cells; **p<0.01. A’, Representative images of BrdU (green)/NeuN (red) immunostaining in the DG of sham and CCI animals 3 weeks after surgery. Arrows indicate some BrdU+/NeuN+ cells (yellow). Arrowheads identify the cells in the higher magnification micrographs (scale bar = 60 micron) (CCI, n = 10, sham, n = 9). B, The percentage of BrdU+/NeuN+ neurons was dramatically reduced in the GCL of neuropathic mice 3 weeks after CCI, and then completely restored 12 weeks later (3 weeks: CCI, n = 10, sham, n = 9; 12 weeks: CCI, n = 9, sham, n = 9). C, The percentage of BrdU+ cells that differentiated into new adult NeuN+ neurons in the OB of CCI mice was similar to shams both 3 and 12 weeks after injury. Mean ± SEM of BrdU+/NeuN+ cells % (BrdU+/NeuN+vs total BrdU+ cells); **p<0.001, CCI vs sham; ##p<0.01, CCI weeks 12 vs week 3 (CCI, n = 9, sham, n = 9). DG=dentate gyrus, GCL=granular cell layer, OBs=olfactory bulbs.

