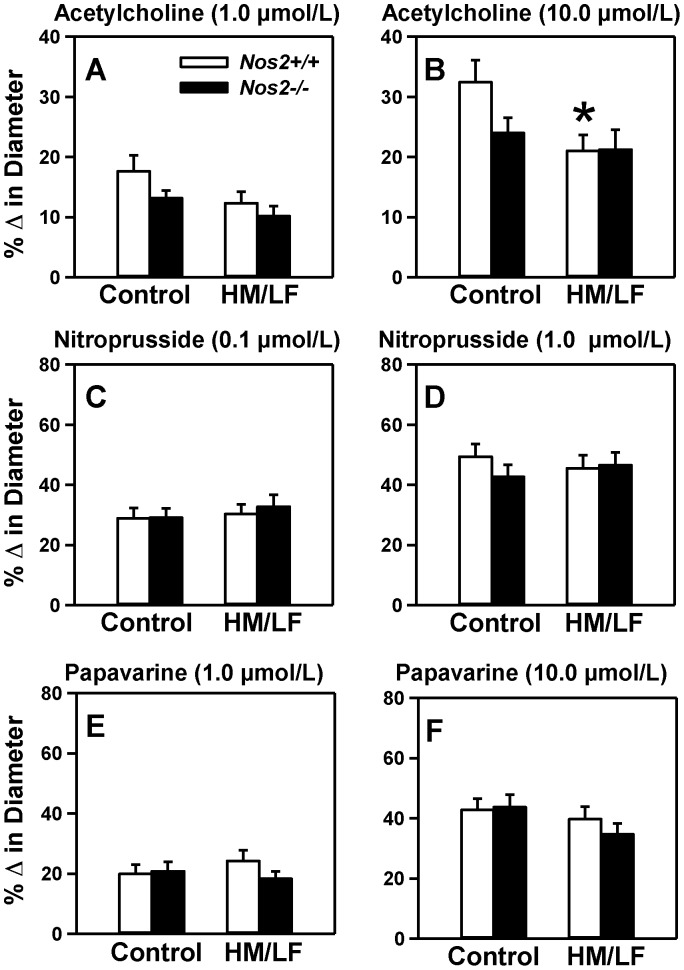
Figure 2. Dilator responses in cerebral arterioles.
Dilatation of cerebral arterioles to (A) 1.0 µmol/L acetylcholine, (B) 10.0 µmol/L acetylcholine, (C) 0.1 µmol/L nitroprusside, (D) 1.0 µmol/L nitroprusside, (E) 1.0 µmol/L papaverine and (F) 10.0 µmol/L papaverine were measured in Nos2+/+ (open bars) or Nos2−/− (filed bars) mice. 10–15 mice were studied in each group. *P<0.05 compared with mice of same genotype fed the control diet by two-way ANOVA.

