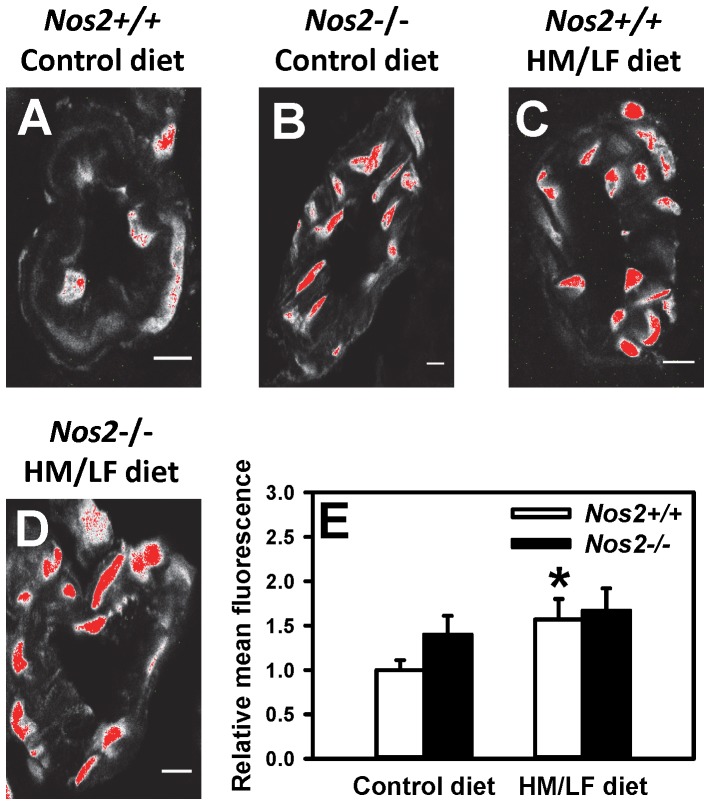
Figure 4. Laser-scanning confocal micrographs of cerebral arterioles stained with DHE.
(A) Nos2+/+ mice fed the control diet. (B) Nos2−/− mice fed the control diet. (C) Nos2+/+ mice fed the HM/LF diet. (D) Nos2−/− mice fed the HM/LF diet. (E) Quantification of DHE fluorescence using Image J. Images are representative of 5 separate experiments. Scale bar = 10 µm.

