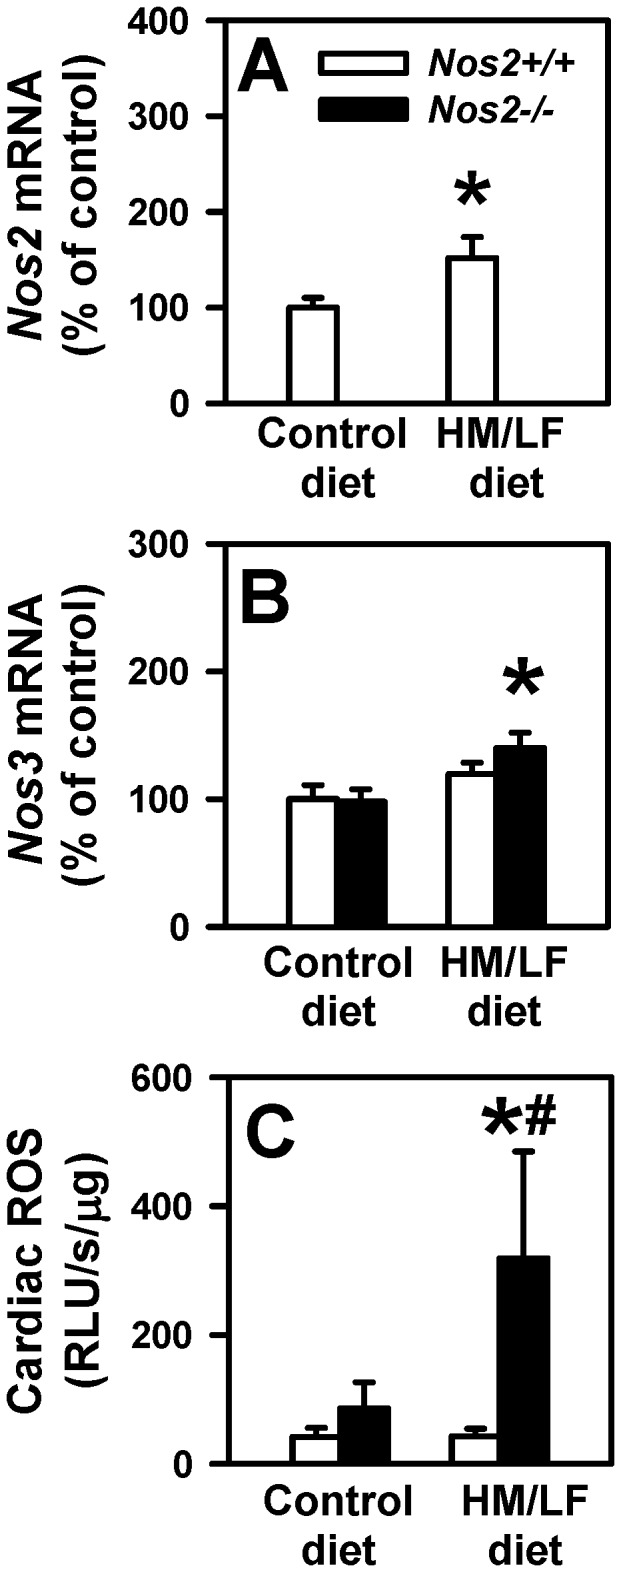
Figure 6. Cardiac levels of Nos2 and Nos3 mRNA and ROS.

Levels of Nos2 mRNA (A) and Nos3 mRNA (B) were measured by real-time PCR in Nos2+/+ (open bars) or Nos2−/− (filled bars) mice. Values were normalized to 18S mRNA and are expressed as percent of the control values observed in Nos2+/+ mice fed the control diet. (C) Tiron-quenchable and NADPH-enhanced lucigenin chemiluminescence was measured in cardiac homogenates. Values are mean ±SE. 6–9 mice were studied in each group. *P<0.05 compared with mice of the same genotype fed the control diet; #P<0.05 compared with Nos2+/+ mice fed the same diet.
