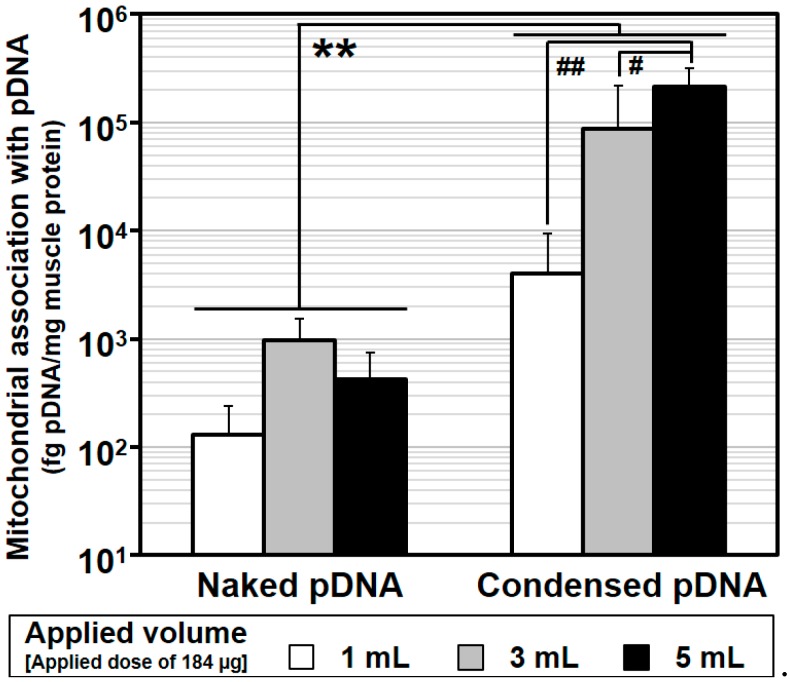
Figure 3.
Comparison between naked pDNA and condensed pDNA for mitochondrial association with pDNA as the result of HLV injection. After the HLV injection of naked pDNA or condensed pDNA particles, the crural muscles were harvested, the pDNA in the mitochondria-enriched fraction was measured using q-PCR. Regarding the values for naked pDNA, these data were previously reported [5]. Open columns represent 184 μg/1 mL, gray columns represent 184 μg/3 mL and closed columns represent 184 μg/5 mL. Bars indicate the mean ± S.D. (n = 3–5). ** Significant differences of mitochondrial association with pDNA between naked pDNA and condensed pDNA (p < 0.001 by two-way ANOVA, followed by Bonferroni correction). Significant differences (## p < 0.01, # p < 0.05) of mitochondrial association with pDNA among injection volumes for naked pDNA and condensed pDNA by two-way ANOVA, followed by Bonferroni correction.

