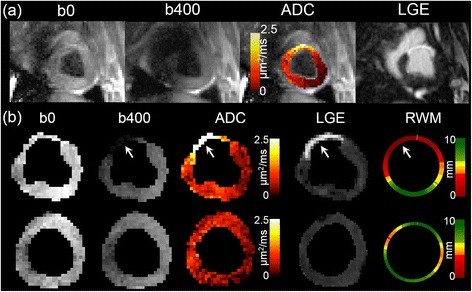
Figure 3.

Typical examples of DWI, ADC Map, LGE image, and RWM Map. (a) Full field of view images of mean DWI (b0 and b400), ADC overlaid onto b0, and LGE shown to illustrate representative image quality. (b) Manual LV segmentation of two representative slices from another animal is shown containing infarct (top row) and no infarct (bottom row). Regions containing infarct defined by increased LGE signal had isointense T2 weighting (b0), hypointense diffusion weighting (b400), hyperintense ADC, and decreased RWM.
