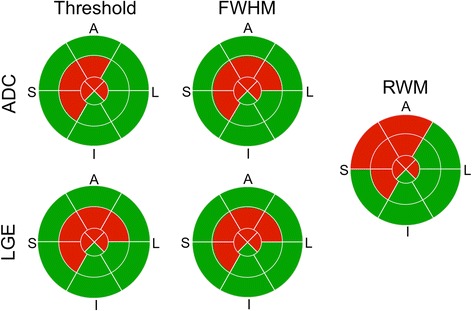
Figure 5.

Representative Bland-Altman and correlation plots of infarct volume comparison between LGE and ADC. The Bland-Altman and correlation plots demonstrated excellent agreement between LGE and ADC using the two infarct volume estimations. Systemic biases were only qualitatively observed in the Bland-Altman plots. The Pearson correlations (R2) of the correlation plots were 0.97 and 0.99 for threshold and FWHM criteria, respectively.
