
Figure 4. UniFrac PCA of the cbbM, apsA and soxB gene clone libraries.
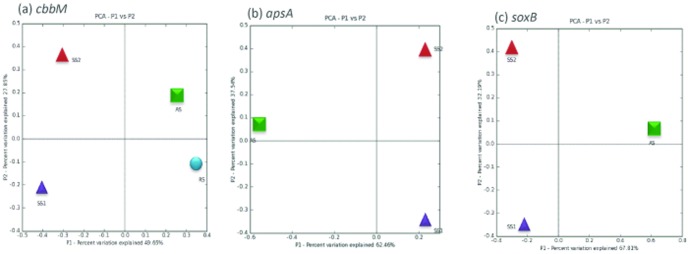
The ordination plots for the first two dimension to show the relationship between saline soils, agricultural and rhizosphere soil types for (a) cbbM (b) apsA and (c) soxB gene assemblages. The saline soils are represented by purple diamond (SS1) and green circle (SS2), agricultural soil (AS) is represented by circle and rhizosphere soil by blue square. Each axis indicates the fraction of the variance in the data that the axis accounts for.