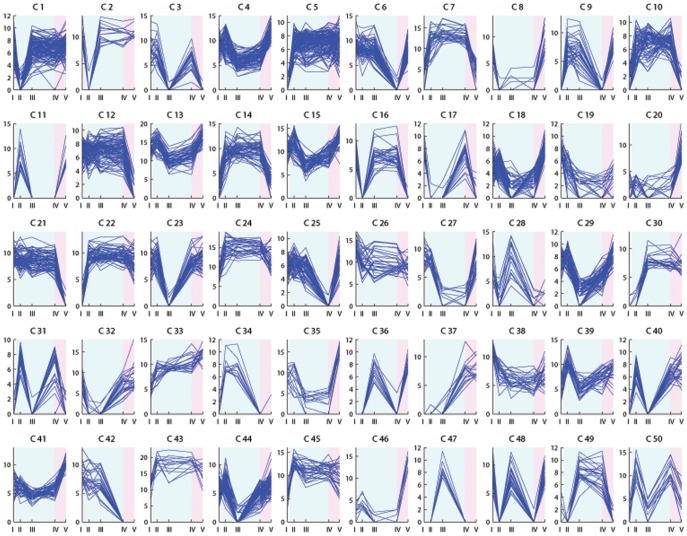
Figure 3. K-means clustering analysis of transcripts differentially expressed in Falster leaf samples.
K = 50 clusters. The x axis presents the sample collection time points: I = autumn conditions, before the start of vernalization; II = 2 days of vernalization; III = 4 weeks of vernalization; IV = 9 weeks of vernalization; V = 7 days of long day conditions. The y axis corresponds to the variance stabilized data from DESeq. The blue background illustrates vernalization treatment, the pink background illustrates long day conditions.

