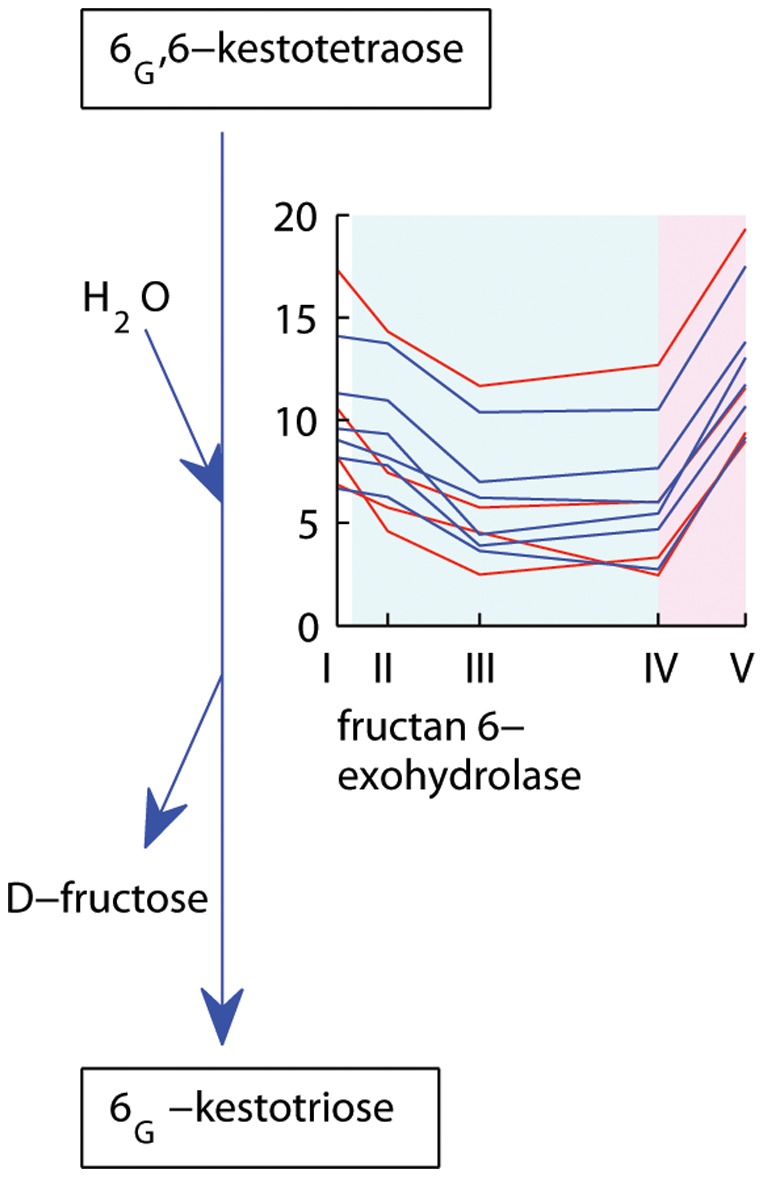
Figure 8. Expression profiles of Falster and Veyo transcripts involved in fructan degradation.

Falster transcripts are depicted in blue, Veyo transcripts in red. The x axis presents the sample collection time points: I = autumn conditions, before the start of vernalization; II = 2 days of vernalization; III = 4 weeks of vernalization; IV = 9 weeks of vernalization; V = 7 days of long day conditions. The y axis corresponds to the variance stabilized data from DESeq. The blue background illustrates vernalization treatment, the pink background illustrates long day conditions. Figure adapted from the Plant Metabolic Pathways database (http://www.plantcyc.org/).
