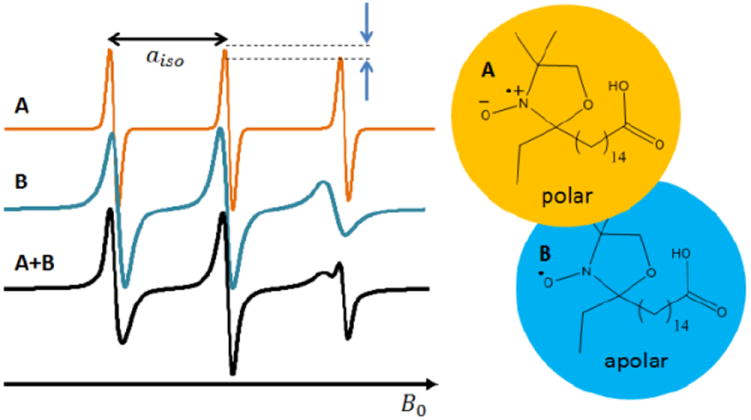
Figure 1.

Environmental sensitivity of a 16-DSA CW EPR spectrum: 16-DSA in a polar environment (A; orange); 16-DSA in an apolar environment (B; blue); combined, bimodal spectrum (A+B; black). The dashed lines mark the difference in intensity between the central line of 16-DSA and the high-field transitions (right), which are dependent on τc. The value aiso approximately corresponds to the separation of the zero crossings of two lines of a fast motion 16-DSA CW EPR spectrum.
