
Figure 6.
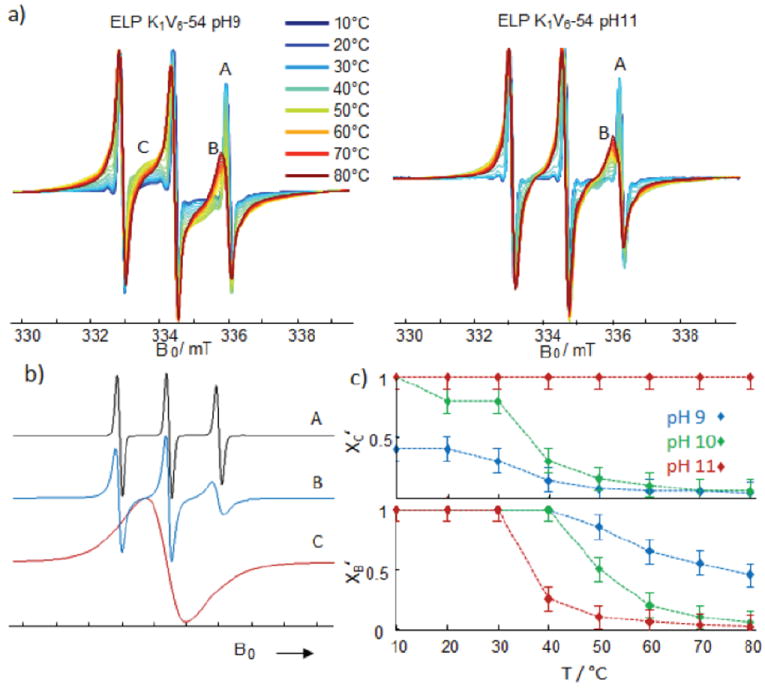
a) Temperature-dependence of CW EPR spectra of 16-DSA in solutions of ELPs K1V6-56 at pH 9 and 11. Spectral components are marked A, B and C. b) Spectral components of spectra depicted in a). c) Relative spectral contribution of species B and C, as defined in b) to the spectra depicted in a) and in the Supporting Information Figure S7 (for pH 10). Note that spectral contributions are related to the axes via mole fractions χi = ni/Σnj. Thus, χB’ and χC’ denote the inverse contribution (compare Figure 2c and d) of species B or C to the experimental spectra normalized to the other two components in each case.