
Table I.
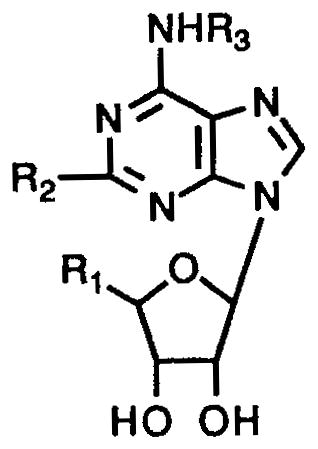
Affinities of adenosine derivatives at rat brain A1, A2a, and A3 receptors, arranged in order of decreasing affinity at rat A3 receptors.a
| ||||||
|---|---|---|---|---|---|---|
| Compound | R1 | R2 | R3 | Ki (μM)
|
||
| Ki(A1) | Ki(A2a) | Ki(A3) | ||||
| 1b | CH3NHCO | Cl | 3-I-Bz | 0.82 | 0.47 | 0.00033 |
| 2c | CH3NHCO | H | 3-I-Bz | 0.054 | 0.056 | 0.0011 |
| 3d | CH3NHCO | H | 3-I-4-NH2-Bz | 0.018 | 0.197 | 0.0013 |
| 4 | CH3NHCO | CH3S | 3-I-Bz | 2.140 | 3.210 | 0.0023 |
| 5 | CH3NHCO | CH3NH | 3-I-Bz | 4.89 | 4.12 | 0.00312 |
| 6e | EtNHCO | H | Bz | 0.087 | 0.095 | 0.0068l |
| 7 | HOCH2 | H | 3-I-Bz | 0.02 | 0.0175 | 0.0095 |
| 8f | CH3NHCO | H | H | 0.0836 | 0.0668 | 0.072l |
| 9g | EtNHCO | H | H | 0.0063 | 0.0103 | 0.113l |
| 10h | HOCH2 | H | 4-NH2-(CH2)2 | 0.014 | 0.172 | 0.116 |
| 11i | HOCH2 | Cl | cyclopentyl | 0.0006 | 0.95 | 0.237l |
| 12j | HOCH2 | H | cyclopentyl | 0.00059 | 0.462 | 0.24l |
| 13k | EtNHCO | NH(CH2)2-φ-p-(CH2)2-COOH | H | 2.6 | 0.015 | 0.584l |
| 14 | HOCH2 | Cl | H | 0.0093 | 0.063 | 1.89l |
a
Ki ± SEM determined in radioligand binding assays expressed in μM (n = 3–6), using the following radioligands: A1, [3H]PIA in rat cortical membranes; A2a, [3H]CGS 21680 binding in rat striatal membranes; A3, [125I]AB-MECA binding, unless noted, in membranes of CHO cells stably transfected with the rat A3-cDNA. A percent value indicates the percent displacement of radioligand at the concentration (M) given in parentheses.
b
Cl-IB-MECA;
c
IB-MECA;
d
I-AB-MECA;
e
Bz-NECA;
f
MECA;
g
NECA;
h
APNEA;
i
CCPA;
j
CPA;
k
CGS 21680.
l
A3 affinity determined versus [125I]APNEA binding.