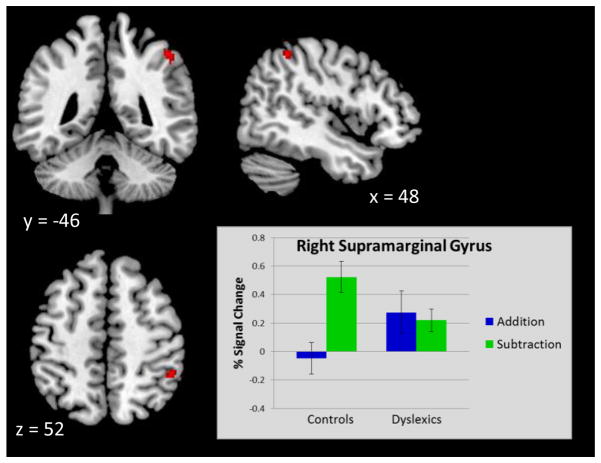
Fig. 3. Diagnostic Group x Arithmetic Operation Effect.
Displayed is a rendering of (Diagnostic Group x Arithmetic Operation) interaction from the factorial analysis. Bar chart displays the percent signal change in typically developing controls and in children with dyslexia for addition (blue) and subtraction (green) conditions. Detailed results can be found in Table 3C.

