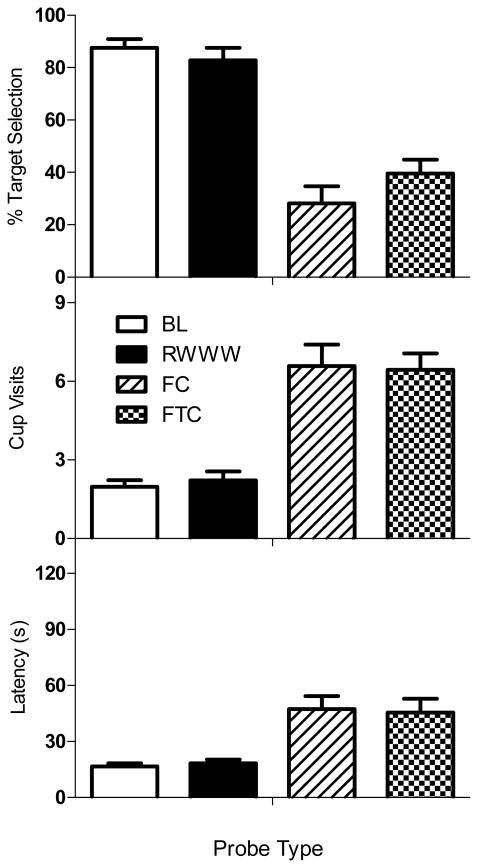
Figure 3.
Responding for each probe type is depicted for percentage of target scents chosen (top), number of cups visited (middle), and latency to a first response (bottom). Data were computed based on the 3 or 4 target probe trials within the probe types: Baseline (white), RWWW (black), Frequency Control (diagonal lines), and Frequency-Time Control (checkered). Error bars represent standard errors of the mean.

