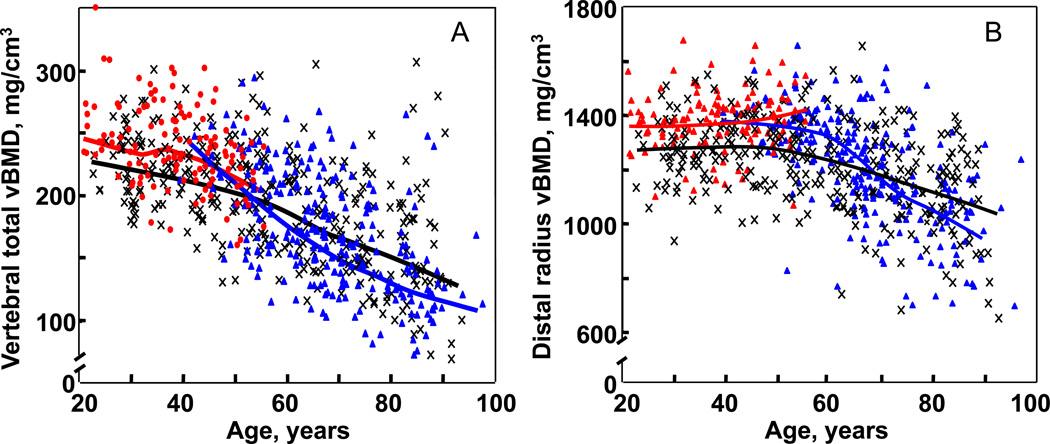
Figure 3.
(A) Values for vBMD (mg/cm3) of the total vertebral body in a population sample of Rochester, Minnesota women and men between the ages of 20 and 97 years. Individual values and smoother lines are given for premenopausal women in red, for postmenopausal women in blue, and for men in black. (B) Values for cortical vBMD at the distal radius in the same cohort. Color code is as in Panel A. All changes with age were significant (P < 0.05). Reproduced from Riggs et al. (16), with permission.

