
Figure 3.
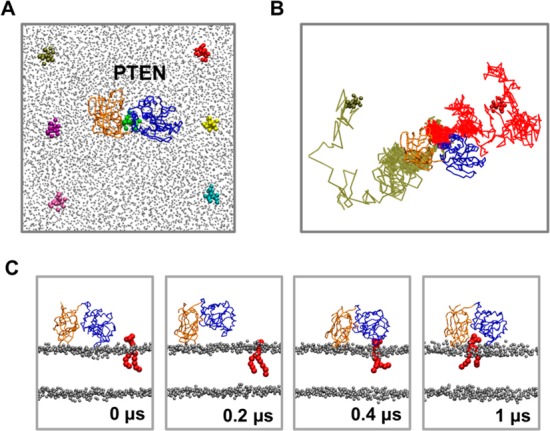
(A) Seven positions in which the PIP3 molecules were placed in the pten_bound simulations (see Table 1). PTEN was placed in the center of the bilayer. POPC and POPS headgroups are shown as gray spheres. (B) Routes from two of the simulations (in one of which the PIP3 lipids reached the PTEN catalytic side via the C2 domain and one via the PD) are colored red and brown. (C) Snapshots from one of the simulations (red in panel B) are shown at 0, 0.2, 0.4, and 1 μs. Note that the systems shown in the figure were fully solvated with CG waters (omitted for the sake of clarity).