
Figure 4.
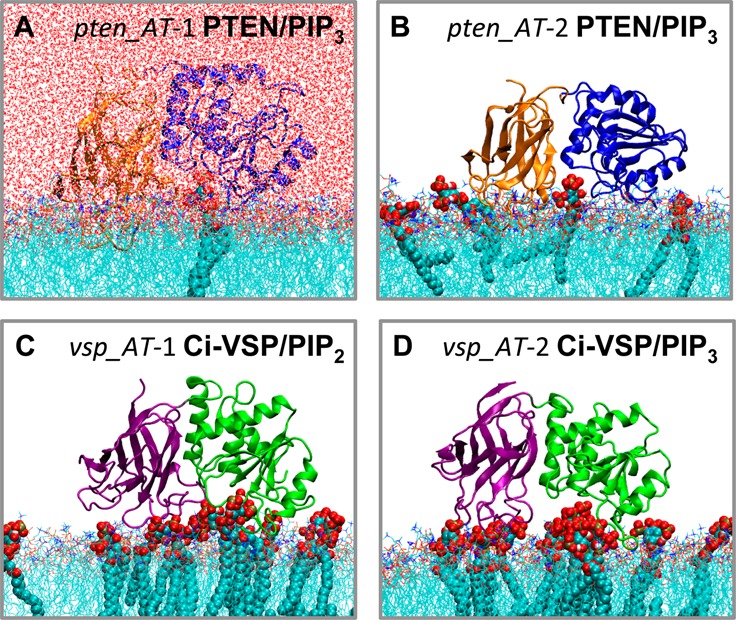
Snapshots of the lipid-bound PTEN and Ci-VSP domains, from the end of all-atom simulations in the presence of PIP2 or PIP3 lipids. (A and B) Snapshots from simulations pten_AT-1 and pten_AT-2, respectively. The PTEN C2 domain is colored orange and the PD blue. (C and D) Snapshots from simulations vsp_AT-1 and vsp_AT-2, respectively. The Ci-VSP C2 domain is colored green and the PD purple. PIP lipids are shown in VDW format. Note that the water molecules included in the simulation box are shown only for the pten_AT-1 simulation system. For the other systems, the waters were included in the simulation (see Methods), but for the sake of clarity, they are not shown in this figure.