
Figure 6.
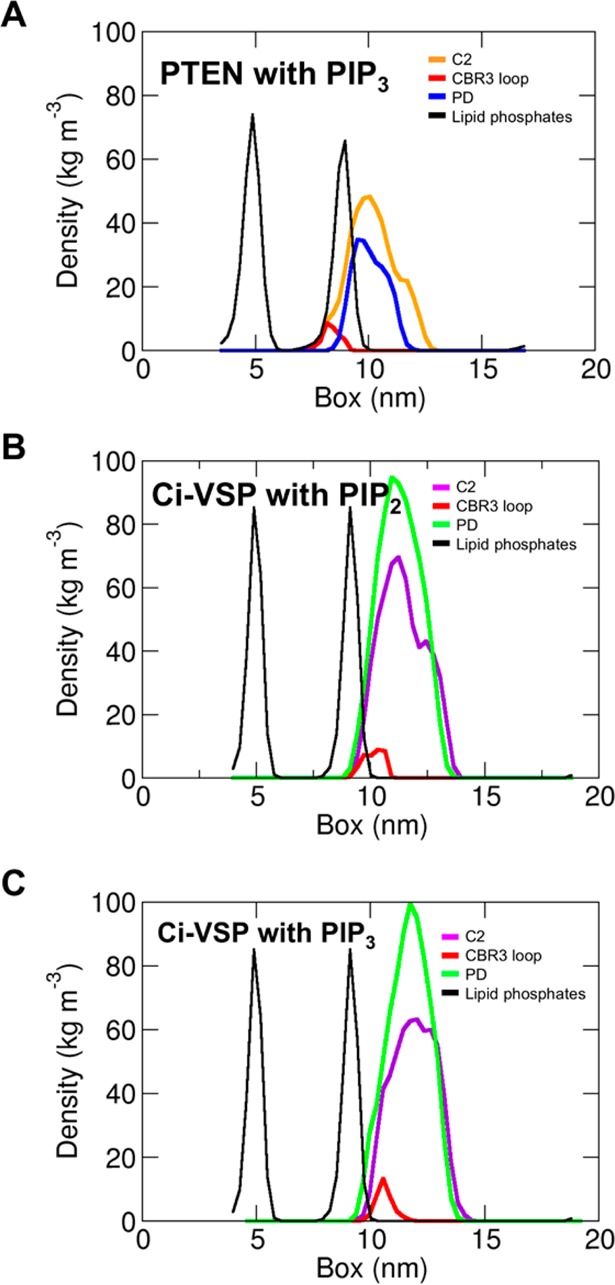
Density profiles along the membrane normal for the C2 domain (orange for PTEN to purple for Ci-VSP), the PD (blue for PTEN to green for Ci-VSP), and the C2 CBR3 loop region (red; residues 261–266 for PTEN to residues 516–524 for Ci-VSP) relative to the positions of the lipid (POPC and POPS) phosphate groups (black), from the (A) pten_AT-1, (B) vsp_AT-1, and (C) vsp_AT-2 simulations.