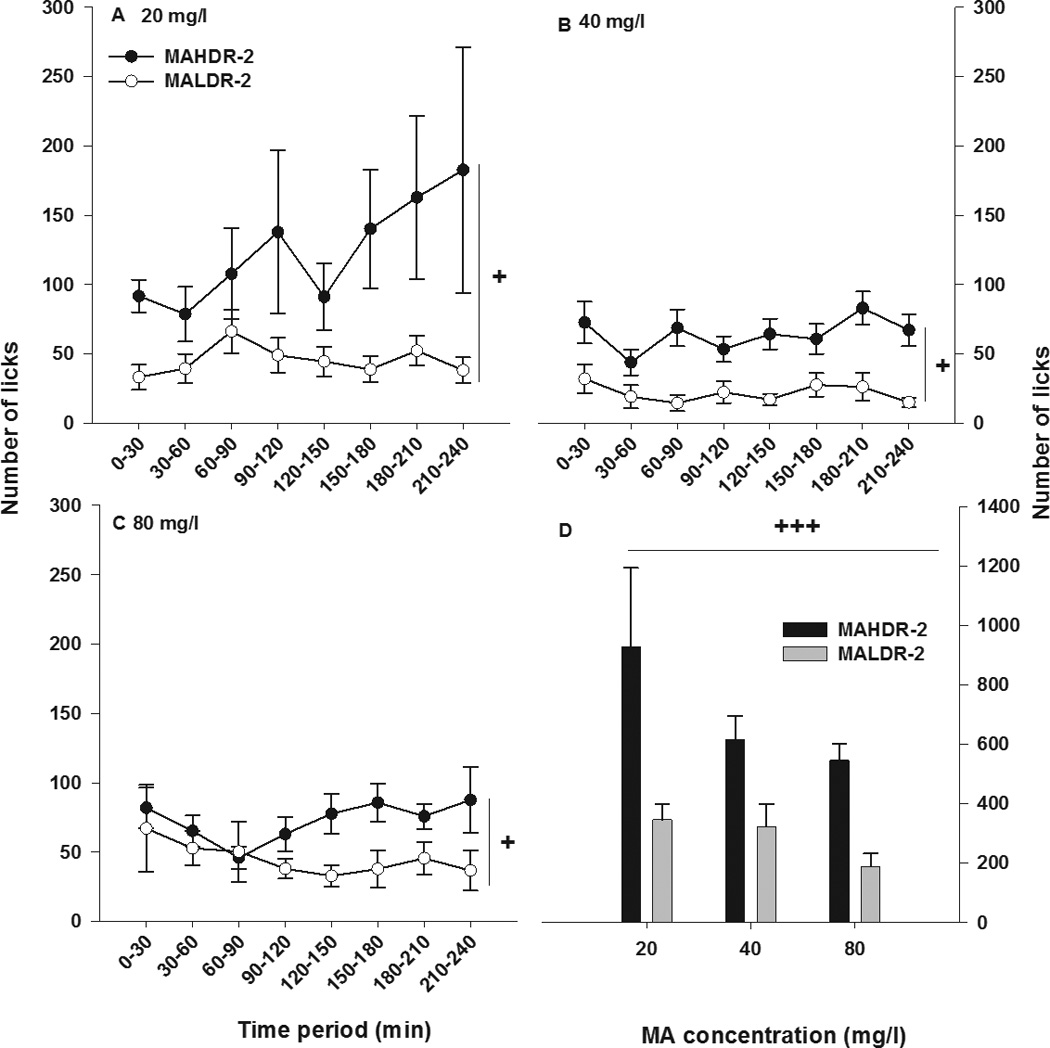
Figure 2. Temporal pattern of licks taken from the MA-containing bottle.

Shown is mean ± SEM number of licks across time taken from the MA-containing bottle at increasing concentrations of MA; (a) 20 mg/l, (b) 40 mg/l, and (c) 80 mg/l. Data are shown in 30-min increments for day 4 of each MA concentration. (d) Mean ± SEM total number of licks taken from the MA-containing bottle, accumulated for the entire 4-h session. +p<0.05, +++p<0.001 for the main effect of selected line. N=17–18/line.
