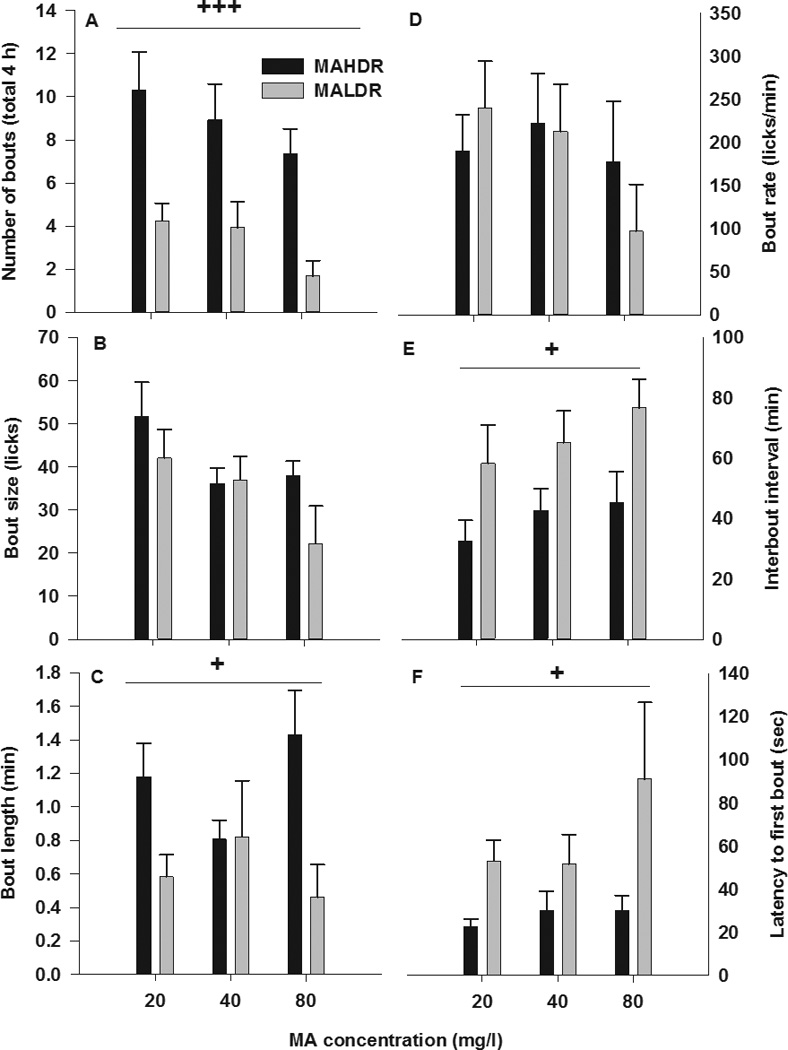
Figure 3. MA drinking pattern characteristics.

Shown is mean ± SEM (a) number of bouts, (b) bout size, (c) length of bout, (d) bout rate, (e) interbout interval, and (f) latency to first bout for MAHDR-2 and MALDR-2 mice for day 4 of each MA concentration. +p<0.05, +++p<0.001 for the main effect of selected line. N=17–18/line.
