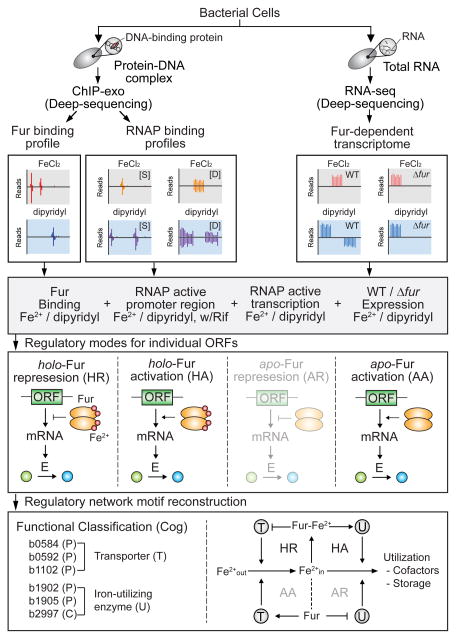
Figure 1. Flowchart of the method.
The in vivo genome-wide Fur-binding maps, RNAP binding profiles (S, static map; D, dynamic maps) and Fur-dependent transcriptomic data were generated under both iron-replete and iron starvation conditions. Combined data sets were used to determine direct Fur regulon and the regulatory mode for individual ORFs governed by Fur. The Fur regulatory network was reconstructed by connecting iron transport and utilization regulatory motifs with negative-feedback loops. The regulatory modes (apo-Fur repression) and motifs (AA/AR pair) that are not identified in this study were presented in translucent format.

