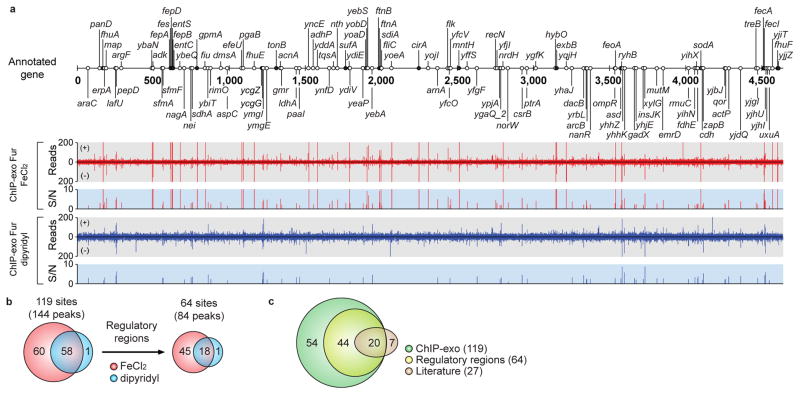
Figure 2. Genome-wide distribution of Fur-binding sites.
(a) An overview of Fur-binding profiles across the E. coli genome at mid-exponential growth phase under both iron-replete (red) and iron starvation (blue) conditions. Black and white dots indicate previously known and newly found Fur-binding sites, respectively. S/N denotes signal to noise ratio. (+) and (−) indicate forward and reverse reads, respectively. (b) Overlaps between Fur-binding sites under iron-replete and iron starvation conditions. (c) Comparison of the Fur-binding sites obtained from this study (ChIP-exo) with the literature information.

