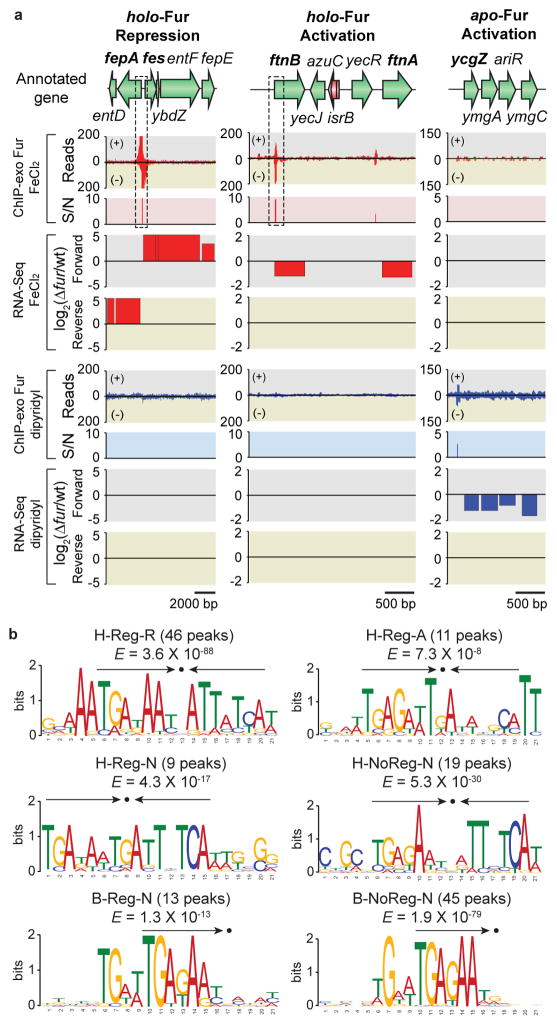
Figure 4. Regulatory modes of individual ORFs governed by Fur in response to iron availability.
(a) Examples of holo-Fur repression (HR) mode (fepA-entD and fes-ybdZ-entF- fepE), holo-Fur activation (HA) mode (ftnB and ftnA), and apo-Fur activation (AA) mode (ycgZ- ymgA-ariR-ymgC). S/N denotes signal to noise ratio. (+) and (−) in ChIP-exo data indicate forward and reverse reads, respectively. Boxes with dotted lines are zoom-in examples in Supplementary Fig. 2. (b) Sequence logo representations of the Fur-DNA binding profiles with consensus sequence highlighted with arrows. H-Reg-R, holo-Fur repression; H-Reg-A, holo-Fur activation; H-Reg-N, holo-Fur binding peaks in regulatory regions but no change in transcript level; H-NoReg-N, holo-Fur binding peaks in non-regulatory regions; B-Reg-N, binding peaks regardless of iron availability in regulatory regions but no change in transcript; B-NoReg-N, binding peaks regardless of iron availability in non-regulatory regions.

