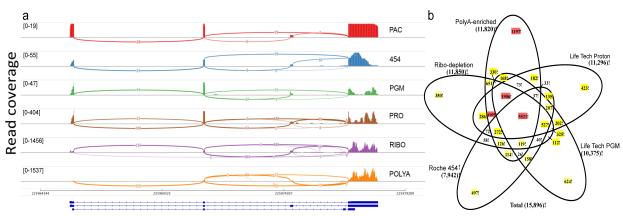
Figure 4. Inter-platform consistency of splicing and differential expression analysis.
(a) As a representative plot for RNA splicing, transcripts from the SRP9 gene are shown in a sashimi plot across five platforms and two Illumina library protocols. Pacific Biosciences (PAC), Roche 454 (454), and Life Technologies Ion PGM (PGM) detected the two most abundant isoforms. Life Technologies Proton (PRO) and Illumina ribo-depletion (RIBO) or polyA-enriched (POLYA) methods also detected a third isoform. PAC showed more uniform sequencing depth across the gene body. Read coverage as measured by the range of 19-1537 (coverage) is indicated in brackets. (b) Starting from the set of genes detected at any expression level on all platforms, the numbers of A vs. B differentially expressed genes uniquely or repeatedly detected at statistically significant thresholds (FDR <0.05 and fold change >2) are shown; sets of greater than 1000 genes are indicated in red, 100-999 in yellow.

