
Figure 2.
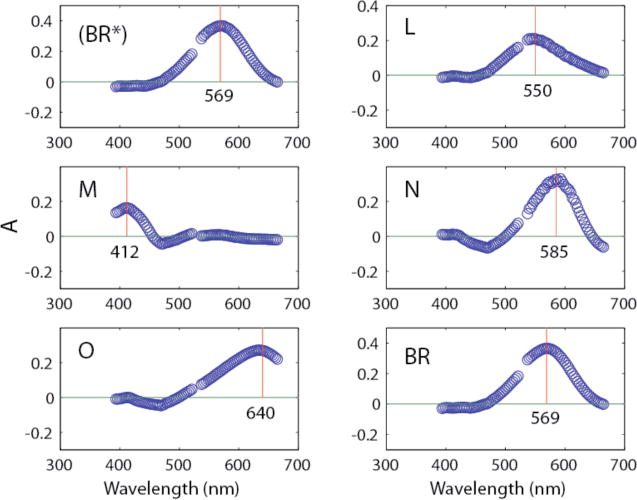
Isolated visible absolute spectra obtained from raw data using equation 2. The vertical lines indicate peak locations in nm as designated in the figure.
Official websites use .gov
A
.gov website belongs to an official
government organization in the United States.
Secure .gov websites use HTTPS
A lock (
) or https:// means you've safely
connected to the .gov website. Share sensitive
information only on official, secure websites.
Isolated visible absolute spectra obtained from raw data using equation 2. The vertical lines indicate peak locations in nm as designated in the figure.