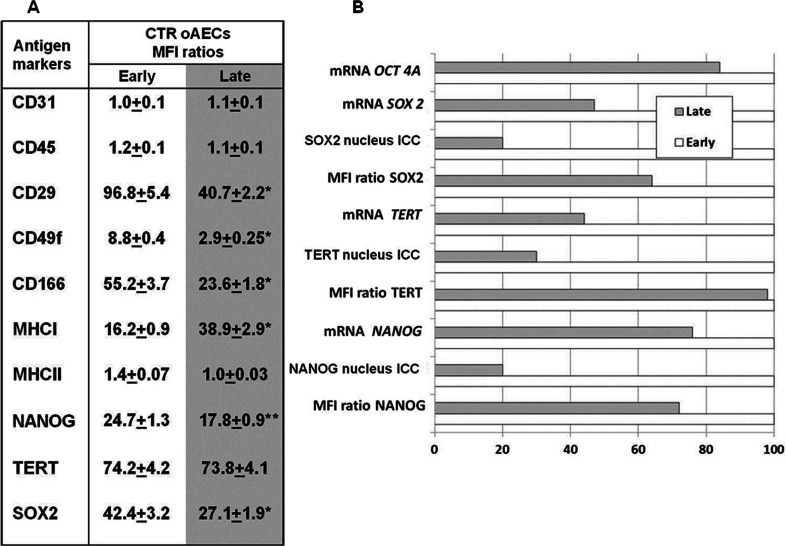
Fig. 3.
a Flow cytometry analysis of haemopoietic (CD31, CD45), adhesion molecules (CD29, CD49f and CD166), MHCI, MHCII and stemness (TERT, NANOG and SOX2) markers, expressed as Mean Fluorescence Intensity (MFI) ratios, in freshly isolated oAECs derived from early or late gestation amnia. * indicates significantly different values between early and late gestational amnia-derived oAECs (p < 0.05). ** indicate very significantly different values between early and late gestational amnia-derived oAECs (p < 0.01). b In the graph are shown mRNA levels (RT-PCR), protein expression (flow cytometry MFI Ratio) and nuclear localization (immunocytochemistry: ICC) of pluripotency markers. To study the differences of pluripotency markers between the two categories of cells, the data obtained from the early gestation oAECs were normalized to 100 % and compared to the relative value obtained by late gestation oAECs. The graph reveals that both the mRNA levels and the nuclear localization of all pluripotency markers were lower in oAECs isolated from late stages amnia

