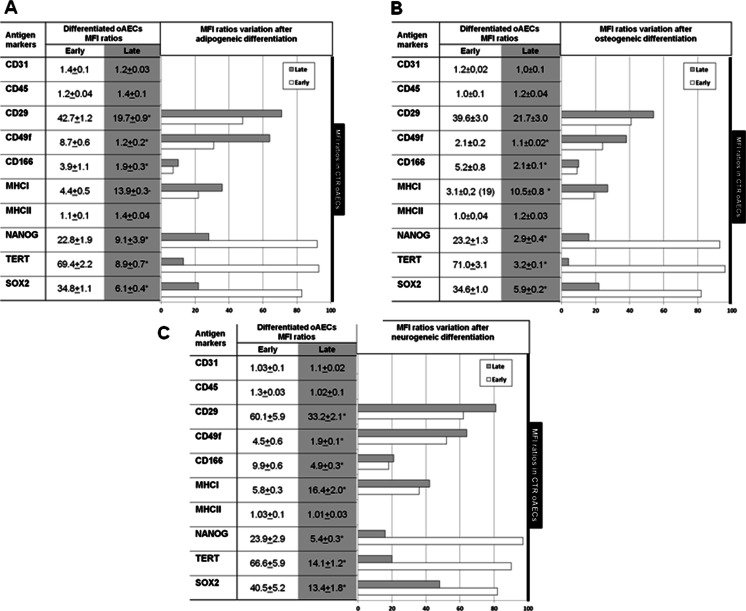
Fig. 6.
a–b–c MFI ratios variation of the analyzed oAEC antigens after in vitro differentiation. On the left of each image, MFI Ratio analyzed by flow-cytometry was calculated in early and late amnia-derived oAECs after adipogenic (a), osteogenic (b), and neurogenic (c) differentiation. * indicates significantly different values between early and late gestational amnia-derived oAECs (p < 0.05). On the right, MFI ratio variations are illustrated before and after in vitro differentiation. To compare antigens expression variation, data obtained from freshly isolated oAECs were normalized to 100 % (visualized by the black bar). These values were then compared to MFI ratios obtained after the in vitro adipogenic (a), osteogenic (b) and neurogenic (c) differentiation in early and late oAECs. All in vitro differentiations slightly affected stemness markers MFI ratios (NANOG, TERT, SOX2) of oAECs isolated at early stages of gestation, while these values were drastically reduced in oAECs collected from late amnia. Adhesion molecules and MHCI MFI ratios were reduced after in vitro differentiation, particularly, in early oAECs

