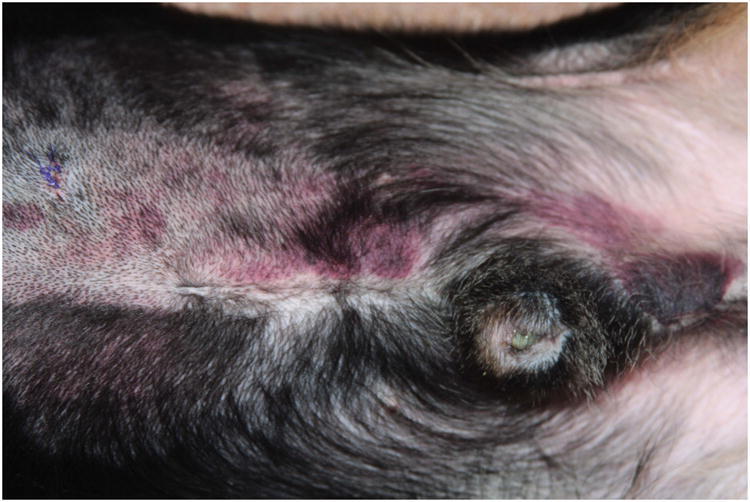
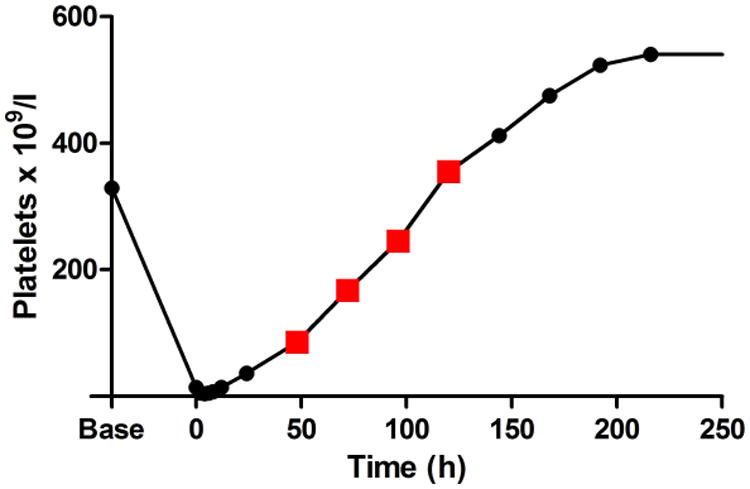
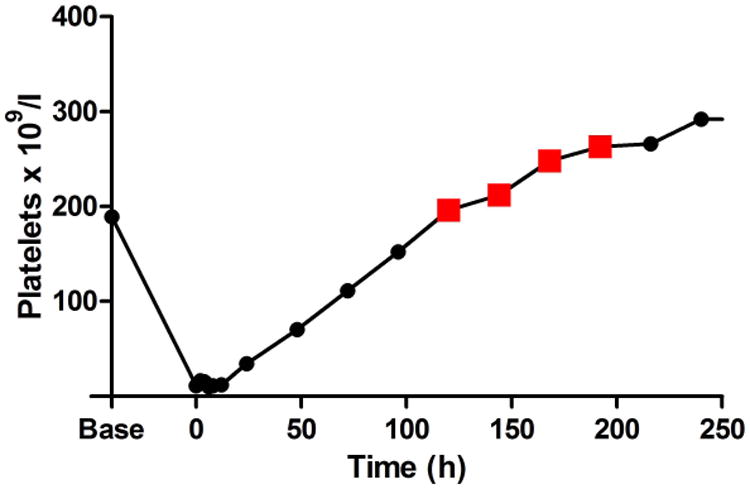
Figure 3. Delayed ecchymosis formation during platelet count recovery.


A. The photograph demonstrates a large abdominal and preputial ecchymosis (8.5 cm × 13 cm at its largest) in one 2F9-treated dog that began to form when platelet count had started to recover and continued to expand when the platelet count had exceeded baseline count. B. Red squares on the graph of platelet count over time demonstrate the period of active bleeding in this dog and in the second dog that developed a delayed ecchymosis (C).
