
Figure 4. Systemic delivery of CpG-Stat3siRNA targets GSCs.
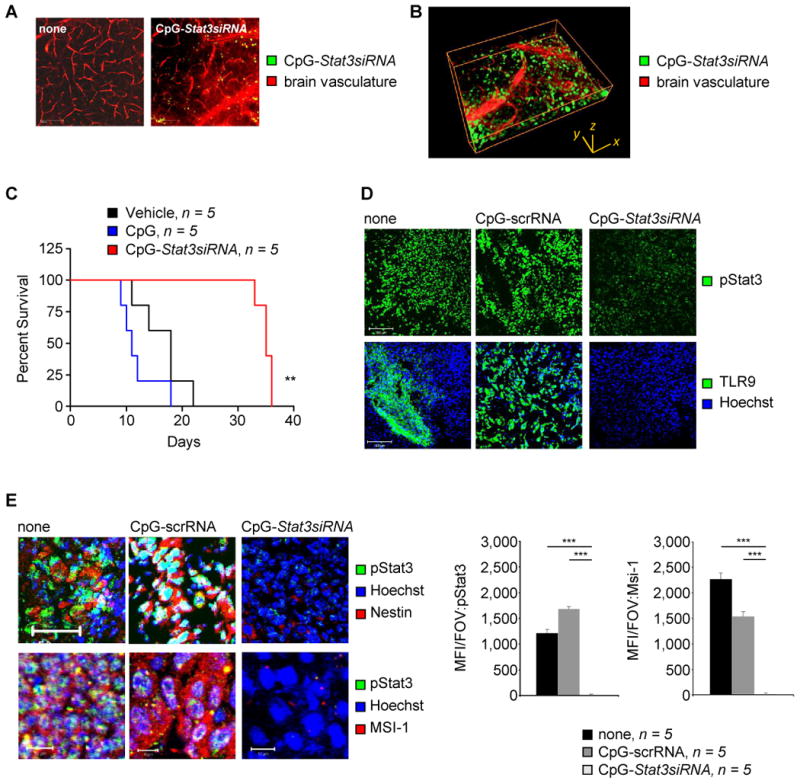
(A) Fluorescently labeled CpG-Stat3siRNA (green) passing the BBB 2h after systemic administration. Ex vivo multi-photon imaging shows CpG-Stat3siRNA in brains of tumor free mice. Scale bar 100 μm. (B) Distribution of fluorescently labeled CpG-Stat3siRNA (green) relative to BBB shown by 3D rendering of ex vivo acquired image z-stack. Dimensions are indicated. (C) Kaplan-Meier plot showing survival of DBT brain tumor-bearing C57BL/6 mice systemically treated with CpG-Stat3siRNA, CpG-ODN or left untreated. Significance is shown: *P ≤ 0.05; **P ≤ 0.01. (D) Confocal microscopic analyses indicating protein expression levels of pStat3 and TLR9 in GL261 mouse brain tumor upon indicated treatments. Scale bar, 100 μm. (E) Confocal microscopic images showing levels of pStat3 in Nestin+ and Msi1+ areas of orthotopically implanted GL261 mouse brain tumors. Treatments are as indicated. Scale bars, 50 μm (upper panels) and 10 μm (lower panels). Right panel: Mean fluorescent intensity per field of view (FOV) quantified; SD and significance shown (n = 5; ***P ≤ 0.001).