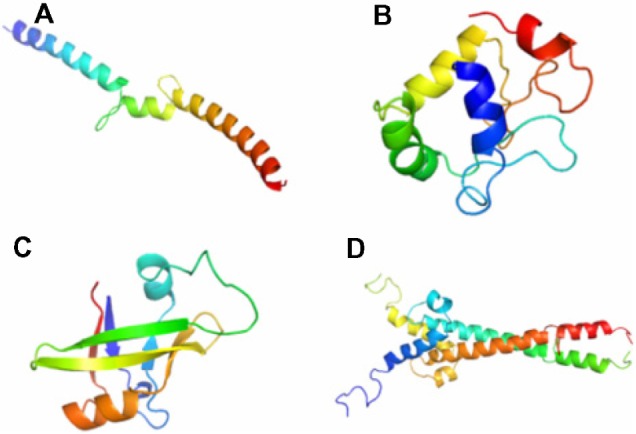
Figure 2.

Modeled structures of transcription factors using Modeller (9v7) (A). bZIP (B). HSF (C). ARF (D). bHLH dimer.
Notes: Using comparative modeling, the structures for four transcription factors were modeled and were further validated by checking the percentage allowed regions in Ramachandran map. The best model was selected on the basis of highest percentage allowed regions and least DOPE score as given by Modeller.
