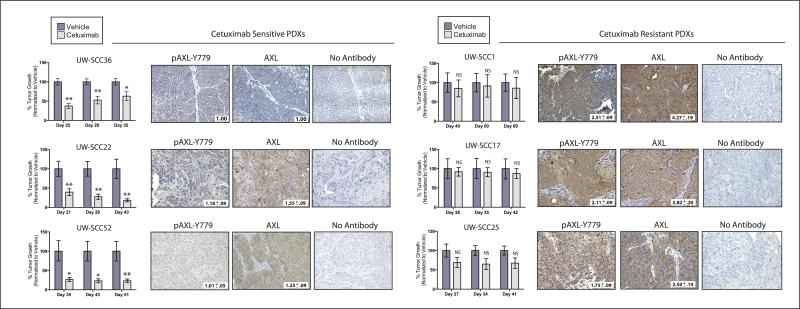
Figure 6. AXL is overexpressed and activated in cetuximab resistant HNSCC PDXs.
PDXs were evaluated for cetuximab response as described in the supplemental materials and methods. Tumor growth was plotted as a percentage of averaged vehicle treated tumor volumes at the last three time points of the study; *p<0.05, **p<0.01. Representative images of IHC analysis of AXL and pAXL-Y779 staining in early passaged PDXs are shown (20X). Quantitation of IHC was performed via Image J software (average of 2-5 independent tumors were stained and imaged); values were normalized to the average staining of UW-SCC36.

