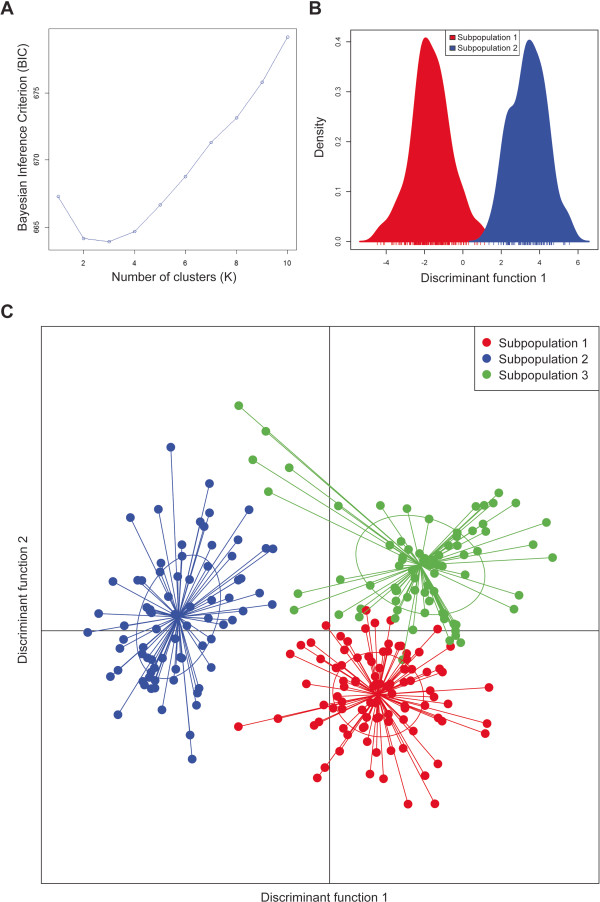
Figure 5.

Discriminant Analysis of Principal Components (DAPC) to infer population substructure. A. Bayesian Inference Criterion (BIC) values versus number of clusters (K) B. Inferred ancestry with K = 2 C. Inferred ancestry with K = 3. Results support STRUCTURE analysis findings that suggest the data are best represented by two or three subpopulations. This analysis however suggests three subpopulations may be more likely than two given the lower BIC value when K = 3.
