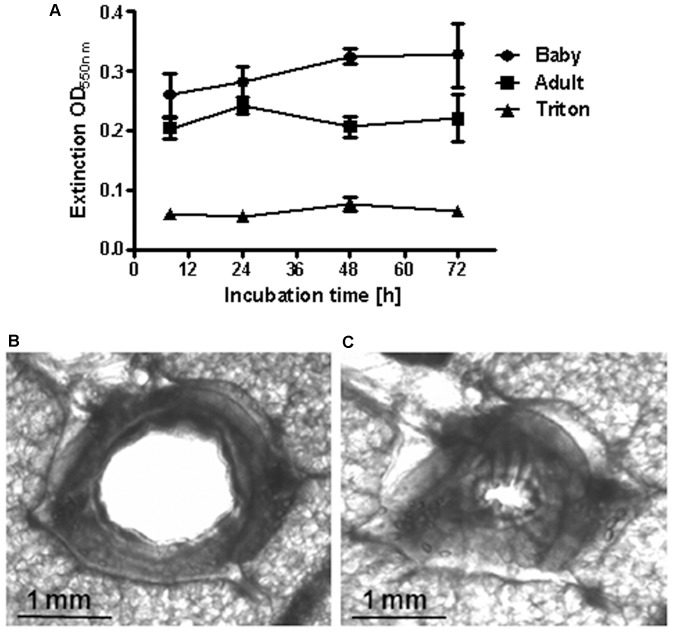
Figure 1. Viability of sheep PCLS.
A) Viability was followed by the MTT test. High extinctions indicate high viability. Data are shown as mean ± SEM, n = 3 PCLS from 3 animals per group. Exemplary photographs (in black and white) of a PCLS before (B) and after (C) provocation with 10−4 M metacholine.

