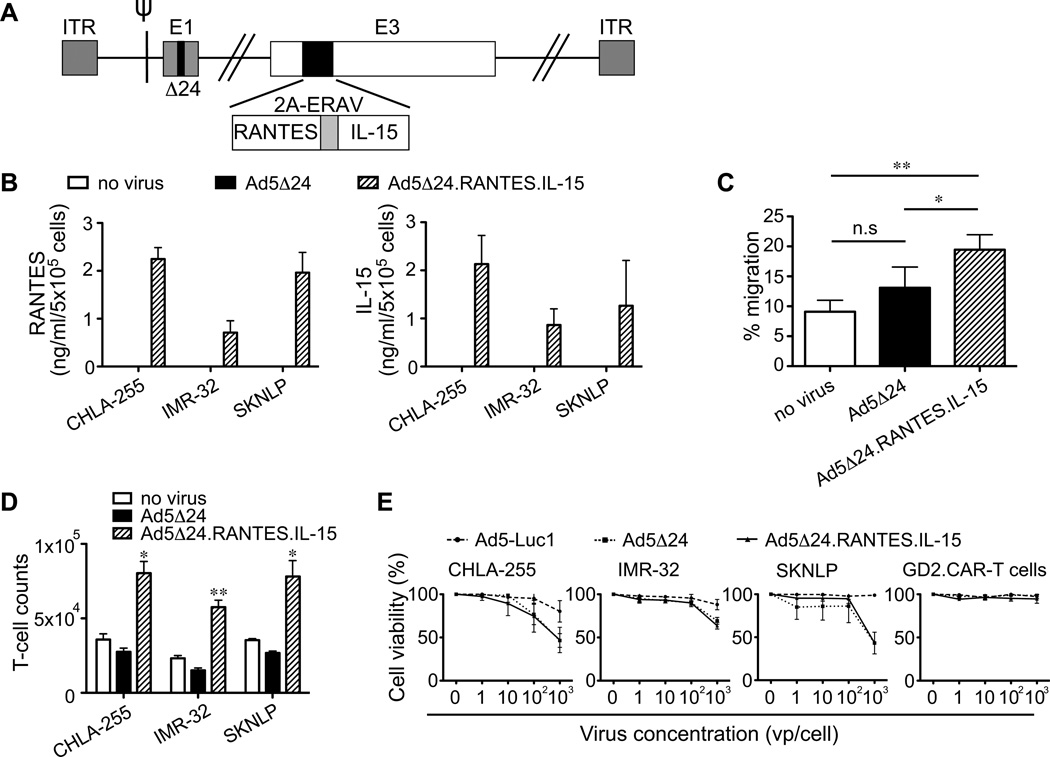
Figure 4. Ad5Δ24.RANTES.IL-15 has oncolytic effects in NB cells and release both RANTES and IL-15.
(A) Schematic representation of Ad5Δ24 encoding RANTES and IL-15. (B) RANTES and IL-15 were detected in the culture supernatant collected from infected NB cells (CHLA-255, IMR-32 and SKNLP). Data represent mean ± SD of 3 independent experiments. (C) The migration of GD2.CAR-T cells was evaluated toward the culture supernatant collected from control and infected SKNLP cells using a transwell migration assay. Data represent mean ± SEM of 4 different T-cell preparations. *P < 0.05; **P < 0.01 by Student’s t test. (D) GD2.CAR-T cell counts in co-culture experiments in which T cells were exposed to control or infected NB cells. T cells were enumerated after 3 days of culture. Data are presented as mean ± SEM of 4 different T-cell preparations. *P < 0.05; **P < 0.01 by Student’s t test. (E) Lytic activity of the viruses in NB cells and GD2.CAR-T cells as assessed by MTS assay. Data represent mean ± SD of 3 independent experiments.

