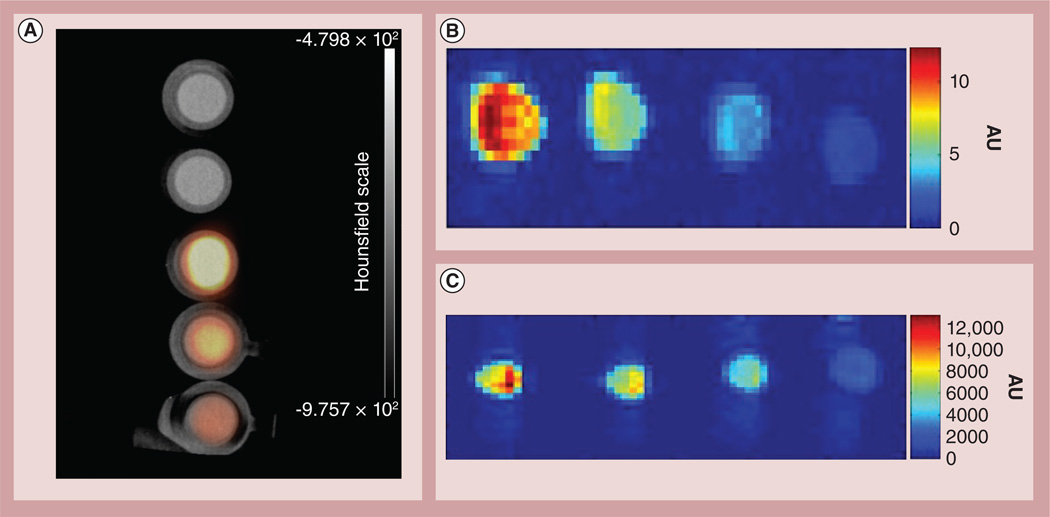
Figure 2. Phantom images of purified US-tubes filled with 64Cu2+ and Gd3+ obtained by positron emission tomography/computed tomography and T1-weighted MRI.
(A) Micro PET/CT image of purified US-tubes filled with 64Cu2+ and Gd3+ at varying concentrations. From top to bottom: Milli-Q® water (Millipore Corp. [MA, USA]), 1% Tween® 20 (Aurion [Wageningen, The Netherlands]), 7.4 MBq/ml, 3.7 MBq/ml and 1.85 MBq/ml. (B) MRI of purified US-tubes filled with 64Cu2+ and Gd3+ at varying concentrations for a 1.5-T field strength. From left to right: 7.4 MBq/ml, 3.7 MBq/ml, 1.85 MBq/ml and 1% Tween 20. (C) MRI of purified US-tubes filled with 64Cu2+ and Gd3+ at varying concentrations for a 3.0-T field strength. From left to right: 7.4 MBq/ml, 3.7 MBq/ml, 1.85 MBq/ml, and 1% Tween 20.
CT: Computed tomography; PET: Positron emission tomography.

