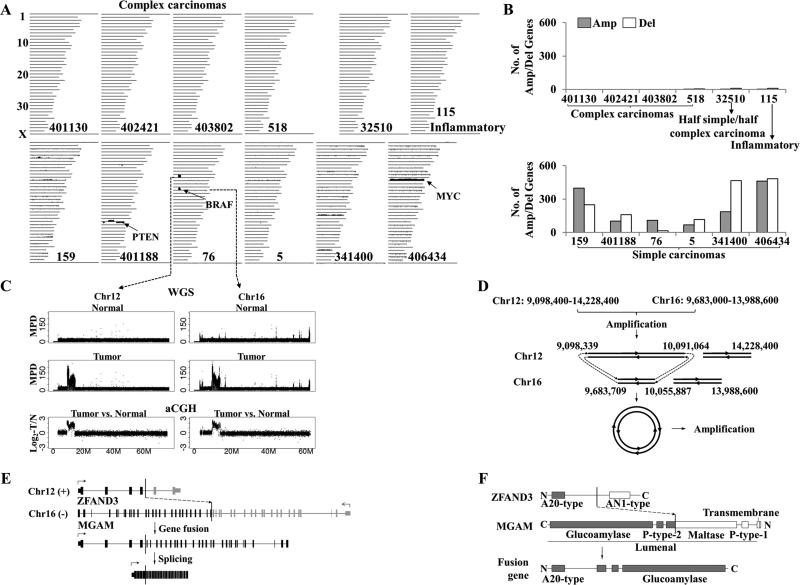
Figure 2. Large scale genomic aberrations are frequent in canine simple carcinomas but rare in canine complex carcinomas.
A, CNAs found in four complex carcinomas (labeled), one half complex and half simple carcinoma (ID 32510) and 7 simple carcinomas (which include the inflammatory tumor 115 and the six tumors at the 2nd panel) by aCGH. The images were drawn as described (5), with each line representing a canine chromosome and vertical lines above/below the chromosome indicating amplifications/deletions, respectively. Notable amplified/deleted genes are shown. B, the total numbers of amplified (shaded bars) and deleted (empty bars) genes of each carcinoma shown in A.
C, two >4Mb amplicons discovered in simple carcinoma 76 in A, by both WGS and aCGH. The X-axis indicates chromosomal coordinates in Mb, while the Y-axis indicates the mapped read pair density (MPD) values of WGS or the tumor against normal log2-ratios of aCGH.
D, the proposed mechanism for superamplicon formation. Prior sequence amplifications led to two translocations (represented by the dashed lines), resulting in a circle which was further amplified. The numbers indicate the chromosomal coordinates in bp.
E, a fusion gene created by the 2nd translocation shown in D. The translocation occurred in the intron of both genes as indicated (exons are represented by the vertical bars). An in-frame fusion transcript then emerged via splicing.
F, the A20-type domain of ZFAND3 and the glucoamylase domain of MGAM are preserved in the fusion protein.

