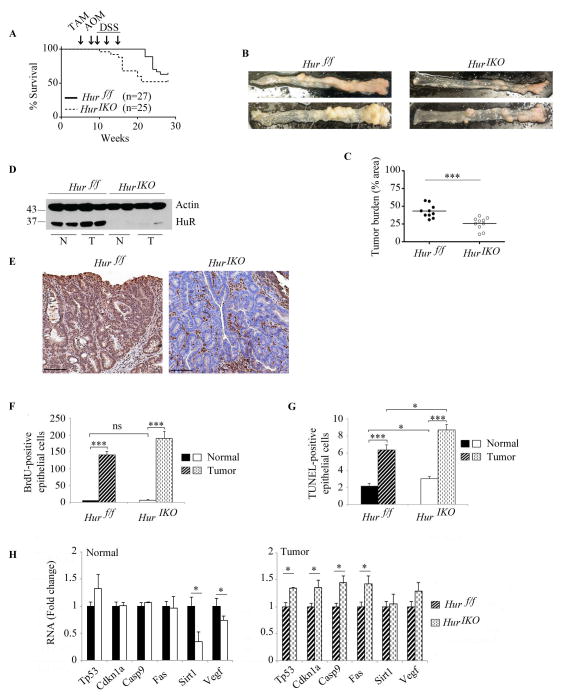
Figure 7. Intestinal HuR deletion protects against AOM-DSS cancer associated colitis.
A, Kaplan-Meier survival curves of Hur IKO and Hur f/f after exposure to AOM-DSS (n=27 Hur f/f and 25 Hur IKO mice). Arrows indicate Tamoxifen-induced Hur knockout (week 5) followed by one injection of AOM (week 8) and three consecutive exposures to DSS (weeks 9, 12 and 15). Log-rank test (Mantel-Cox) was not significant (P value 0.137). B, Gross morphology photographs of colon from Hur f/f and Hur IKO 20 weeks after exposure to AOM-DSS. C, Pinned colons were analyzed under dissecting microscope and surveyed for total polyp number and size relative to total colon area. Hur IKO mice show a significantly reduced tumor burden, *** P<0.001. D, Western blot analysis of HuR in protein extracts prepared from full thickness normal (N) and tumor (T) tissues isolated from Hur f/f and Hur IKO mice treated with AOM-DSS. Note the increased expression of HuR in tumor isolated from control animals. E, Representative HuR staining of polyps in colon from Hur f/f and Hur IKO mice. Note the complete absence of HuR in epithelial cells with staining confined to the stroma. Scale bars 50 μm. F, Hur IKO mice treated with AOM-DSS show no alteration of cell proliferation. BrdU-positive epithelial cells were counted and data are represented as total number of BrdU-positive cells per high magnification power (40X). On average 16 fields were evaluated per mouse. (n=3 to 4 mice per genotype). Data represent mean ± SE, *** P<0.001. G, Hur IKO mice show increased apoptosis 20 weeks after AOM-DSS administration. Apoptotic cells were visualized by TUNEL staining and counted. Data represent total number of TUNEL-positive epithelial cells per high-resolution field (40X magnification). Six to 10 fields were analyzed per mouse. (n=3 to 5 mice per genotype). Data represent mean ± SE, * P<0.05; *** P< 10 −10. H, Following AOM-DSS exposure, Hur IKO mice showed elevated expression of a subset of RNAs encoding pro-apoptotic factors. RNA was extracted from normal and tumor tissues. RNA expression was evaluated by quantitative PCR and normalized to Gapdh RNA. Data are represented as mean ± SE (n=3 to 5 per genotype) * P <0.05.

