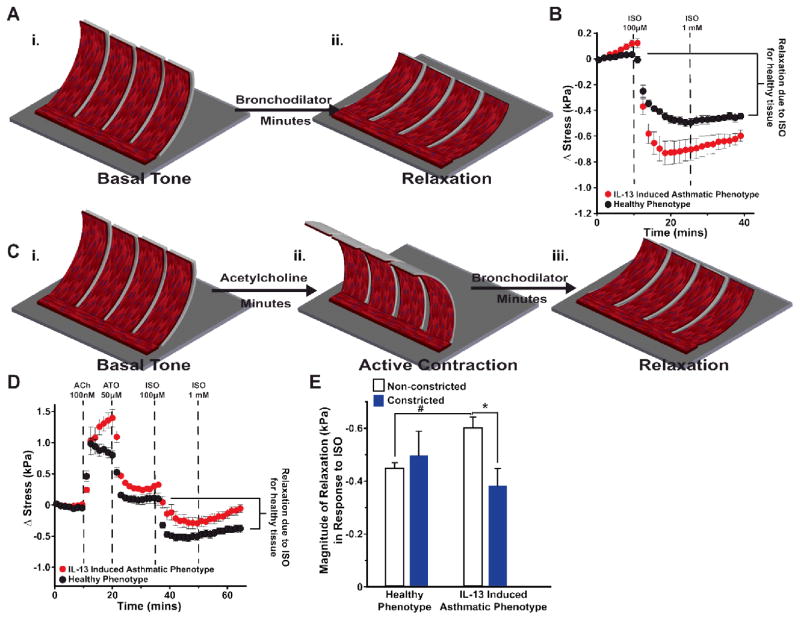
Fig. 2.
Impaired relaxation due to synergistic effect of IL-13 and ACh. (A) Schematic depicting (i) the basal tone and (2) bronchodilator-induced relaxation of bMTF chip. (B) Relaxation was quantified in response to the β-agonist isoproterenol (ISO). Stress is measured from the basal tone. n=12 films, 2 chips for the healthy phenotype; n=10 films, 2 chips for the IL-13 induced asthmatic phenotype. Data points represent mean ± standard error. (C) Schematic depicting (i) basal tone (ii) preconstriction and (iii) bronchodilator-induced relaxation of airway on a chip after initially constricting the tissue. (D) Tissues were constricted using ACh then subsequently treated with atropine (ATO) 50 μM, isoproterenol (ISO) 100 μM, and ISO 1 mM in series to induce relaxation. Stress is measured from the basal tone. n=11 films for the healthy phenotype, 2 chips; n=12 films, 2 chips for the IL-13 induced asthmatic phenotype. Data points represent mean ± standard error. (E) The magnitude of relaxation in response to ISO was quantified for non-constricted tissues (dark gray) and constricted tissues (black). For non-constricted tissues, the change in stress was measured between the basal tone and the tone after administration of 1 mM ISO (seen in the stress traces in Fig. 2B). For constricted tissues, the change in stress was measured between the tone after administration of 50 μM ATO and the tone after administration of 1 mM ISO (seen in the stress traces in fig. 2D). * and # indicate p<0.05.

