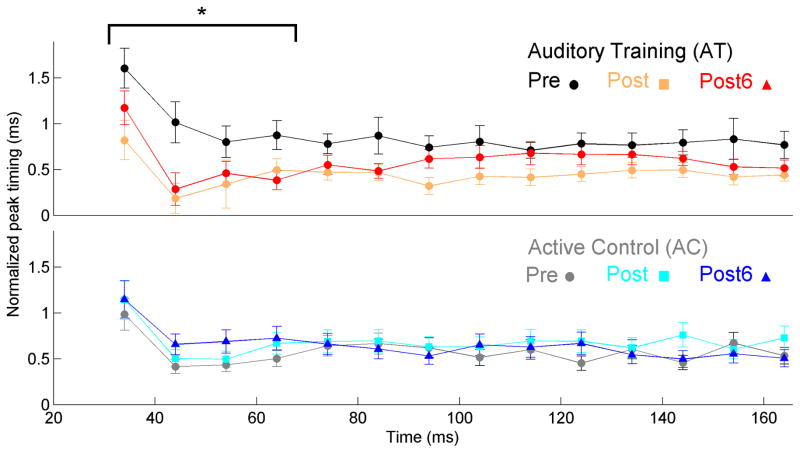
Figure 3.
In noise, the reduction in peak latencies in the region corresponding to the consonant-vowel transition (20–60 ms, marked with brackets) that was found after 8 weeks of training was maintained at the six-month follow-up visit. To facilitate visualization of the data across time, peak latency values are normalized by subtracting individual absolute latencies from the expected response latencies for each peak based on average data in young adults, taking into account stimulus characteristics and neural lag (Anderson et al., 2012). Therefore, faster timing corresponds to smaller differences between actual and expected latency values. Expected latencies were 9 ms for the onset, and 34, 44, 54, 64, etc., until 164 ms for peaks during the transition and steady-state. No latency changes were seen in the active control group. *p < 0.05 – significance value for the pre to post-6 change in latency. Error bars = +/− 1 S.E.

