
Fig. 3. Colony formation capacities of U-87 MG with siRNA transfection.
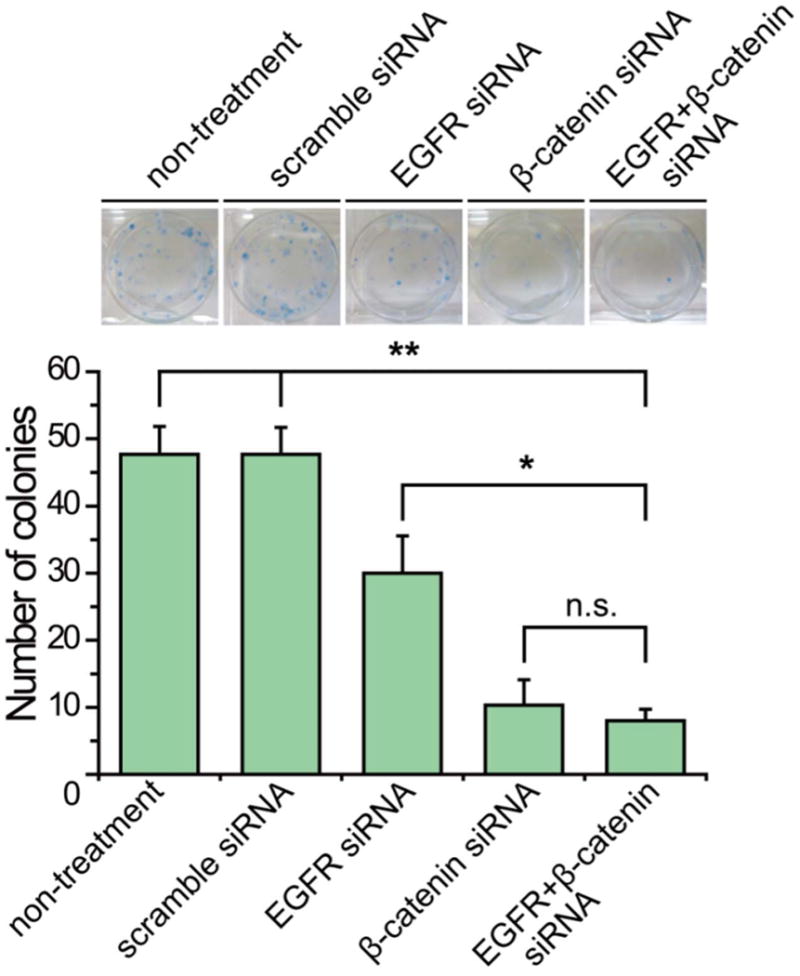
Colony formation of U-87 MG cells transfected with scramble, EGFR and β-catenin siRNA is represented as in the images. The mean ± SD number of colonies was quantified and presented in the bar graph. Asterisk indicates significant level in Student's t-test: *P < 0.05, **P < 0.01, n.s.: non-significant.