
Fig. 4. Representative cell cycle distributions in U-87 MG transfected with control siRNA and targeted siRNA individually and in combination.
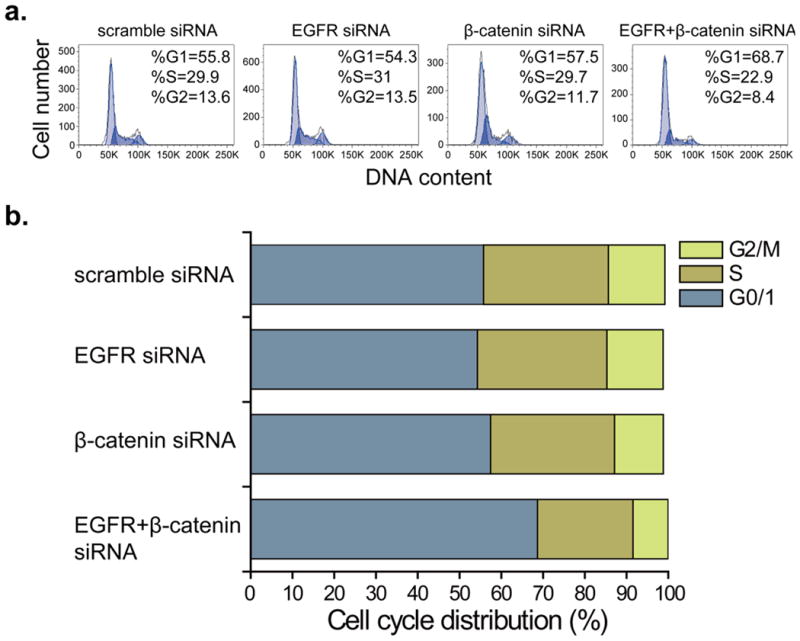
(a) Cell cycle phase distribution of U-87 MG cells after siRNA transfection for 72 h. (b) Bar graph indicates the proportions of cells in G0/1, S and G2/M phases of the cell cycle. All experiments were performed in duplicate and gave similar results.