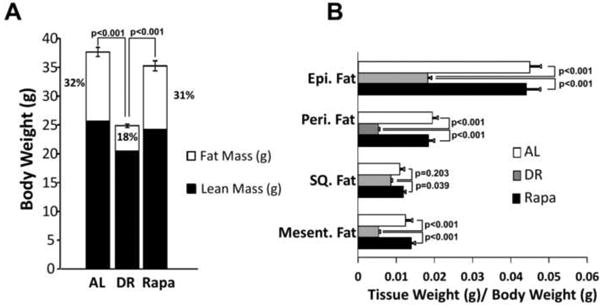
Figure 1. Effect of DR and rapamycin on body fat and fat depots.

Weight (gr) of the distribution of lean mass (solid bars) and fat mass to body weight (open bars), respect to total body weight. (A), determined in AL (open bars), DR (grey bars), and Rapa (solid bars) in fed mice at 8 months of age (after 6 months of treatment). Fat depot weights are shown relative to body weight (B) at 8 months of age. The data were obtained from 11-12 mice per group and expressed as mean ± standard error of the mean (SEM). Data were analyzed using one-way ANOVA with the Tukey's post-hoc test; the p-values are marked for the values that are significant.
