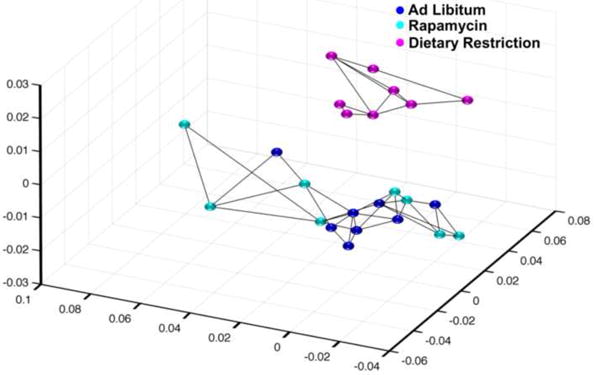
Figure 2. Multidimensional Scaling (MDS) analysis shows that DR is different from AL and Rapa.

Using all the probes detected (24,114 probes) with a p-detection value of 0.02, the MDS analysis is shown in a 3D plot. Each point represents one sample, with AL groups in blue, DR groups in magenta, and Rapa groups in cyan color. The lines between points indicate the nearest neighbors.
