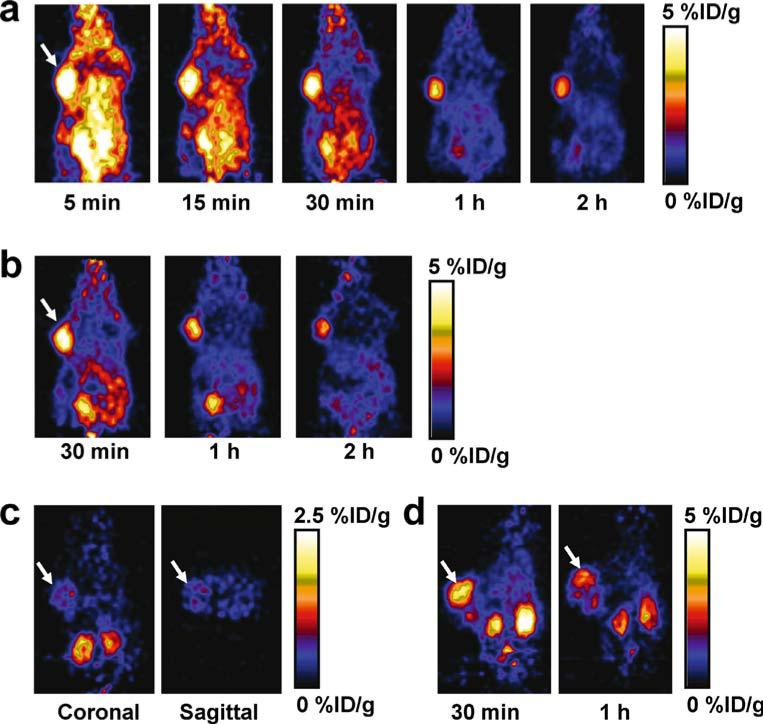
Fig. 2.
a Serial microPET images of U87MG tumor-bearing mice after intravenous injection of 18F-FPRGD2. b For direct visual comparison, serial microPET images of U87MG tumor-bearing mice after intravenous injection of 18F-FRGD2 are also shown. c Coronal and sagittal microPET images of a U87MG tumor-bearing mouse 1 h after co-injection of 18F-FRGD2 and a blocking dose of c(RGDyK). Note that the scale (0–2.5%ID/g) is different from those in a and b (0–5%ID/g). d MicroPET images of a c-neu oncomouse after intravenous injection of 18F-FPRGD2. Arrows indicate tumors in all cases

