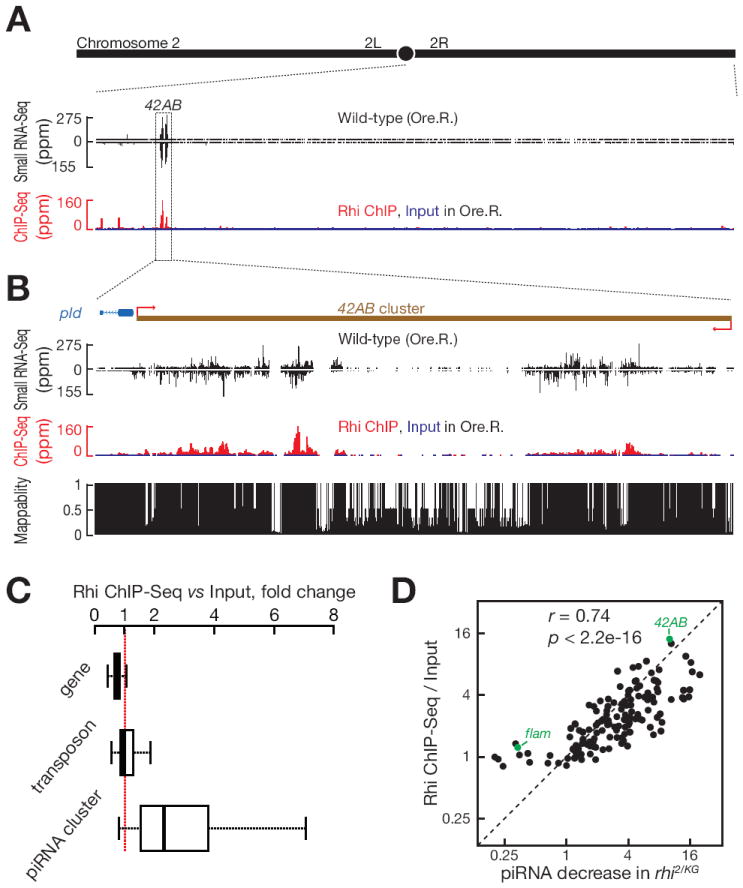
Figure 1. Rhi binding correlates with piRNA production.

(A) piRNA and Rhi ChIP-Seq signal across the right arm of chromosome 2.
(B) piRNA and Rhi ChIP-Seq signal across the 42AB piRNA cluster, which produces ~ 30% of fly ovary piRNAs.
(C) Boxplots showing Rhi enrichment at protein coding genes, transposons and piRNA clusters. Outliers are not shown.
(D) Rhi binding correlates with Rhi-dependent piRNA production. Scatter plots showing Rhi binding enrichment (y-axis) relative to reduction in piRNA production in rhi2/KG mutants (x-axis). Each point represents a distinct piRNA cluster. Pre-I.S. is Pre-Immune Serum. The major germline piRNA cluster at 42AB and the major somatic cluster (flam) are indicated in green.
See also Figure S1 and S2.
