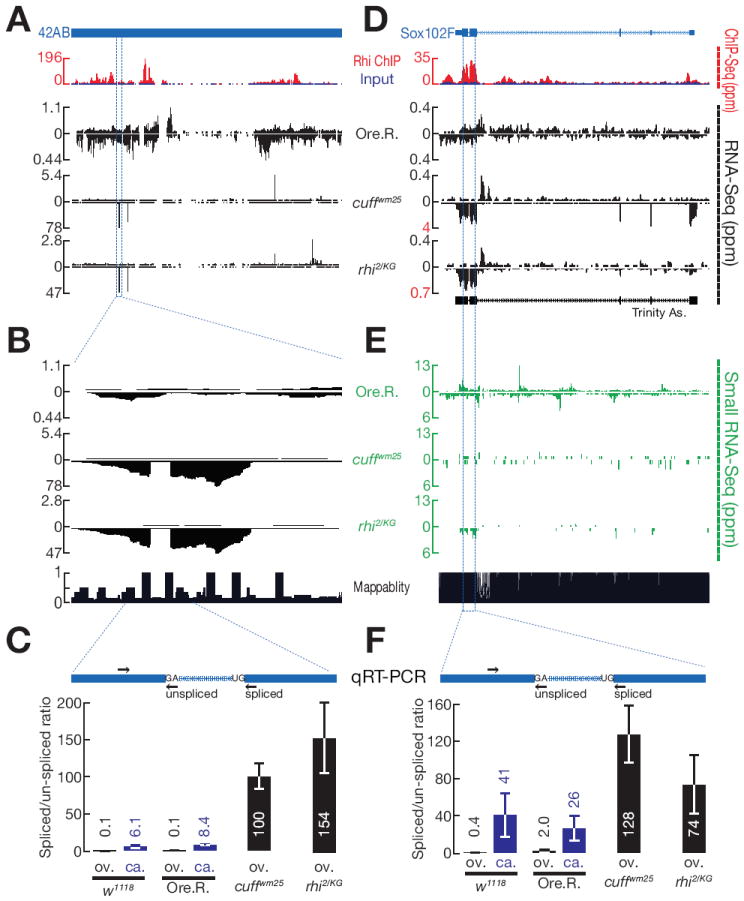
Figure 2. Rhi and Cuff suppress splicing at the 42AB and sox102F clusters.

A, D. Rhi ChIP-Seq and RNA-Seq profiles for the 42AB cluster (A) and sox102F locus (D) are shown. For ChIP-Seq, Rhi signal (red) is superimposed on input (blue). RNA-Seq is shown for Oregon R (Ore. R.) control, cuff and rhi mutants. In Ore. R. controls, signal is spread over both 42AB and sox102F. In rhi and cuff mutants, by contrast, signal shifts to distinct peaks (Note that data are scaled to avoid peak clipping). At the sox102F locus, the boundaries correspond to annotated splice sites in the mature somatic transcript, and de novo transcript assembly from these data yields the annotated gene structure (Trinity As.)
(B) A high resolution expansion of the indicated region of 42AB shows that the peak is interrupted by a region with little signal, defined by very sharp boundaries characteristic of intron removal.
(C, F) qRT-PCR quantify the splicing efficiency at 42AB (C) and sox102F (F) loci. The diagrams show the putative introns (blue) and the position of primers (arrow) used to assay unspliced and spliced transcripts at 42AB (C) and sox102F (F). Both spliced and unspliced transcripts are amplified using the same forward primers. Reverse Primers for unspliced transcripts span the splice site and for spliced transcripts span the mature junction. Bar graphs show the ratio of spliced to unspliced RNAs in ovary (ov.) and carcass (ca.) in two different control strains (w1118 and Ore. R.) and in cuff and rhi mutants. In ovaries, splicing at 42AB and sox102F increases over 80 fold in both cuff and rhi mutants. The sox102F locus is expressed in somatic tissue present in the carcass, and the transcripts are spliced. Data are mean ± standard deviation for 3 independent biological samples.
(E) piRNA production from sox102F locus in Ore.R., cuff and rhi mutants.
See also Figure S3, S4 and S5.
