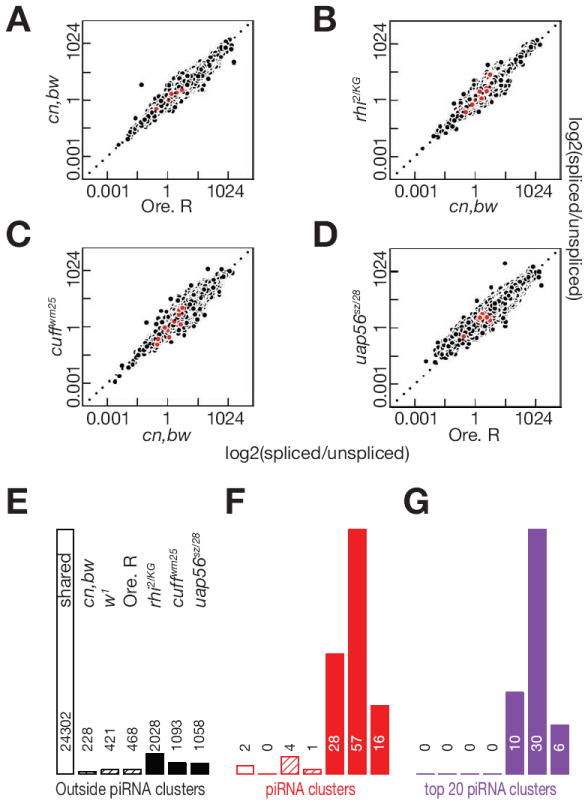
Figure 3. rhi, cuff and uap56 mutations do not alter global splicing efficiency, but lead to splicing of novel cluster introns.

A-D. Scatter plots showing splicing efficiency at introns shared between the two indicated genotypes. Each point is one intron. Cluster mapping introns are in red and introns mapping outside clusters in black. E-G. Bar graphs quantifying shared and genotype specific introns. Introns outside of piRNA clusters are in black, introns mapping to all clusters are in red, and introns mapping to the top 20 clusters are in purple. Introns shared by the cn,bw, w1 and Oregon R control strains are indicated by the open bars. Mutant specific introns are in solid bars. For each set of bar graphs, the genotypes are ordered as in E, and the number of introns detected is above or within the bar.
