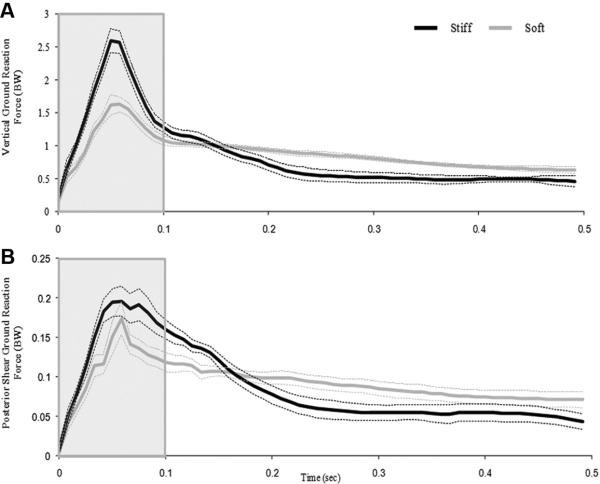
Figure 6.
A, the mean and standard deviation of the vertical ground-reaction force during soft and stiff landings versus time. Stiff landings are shown in black and soft landings in gray. The boxed area indicates the portion of the landing phase that was captured in the biplane fluoroscopy system. B, the mean and standard deviation of the posterior shear ground-reaction force during soft and stiff landings versus time.

