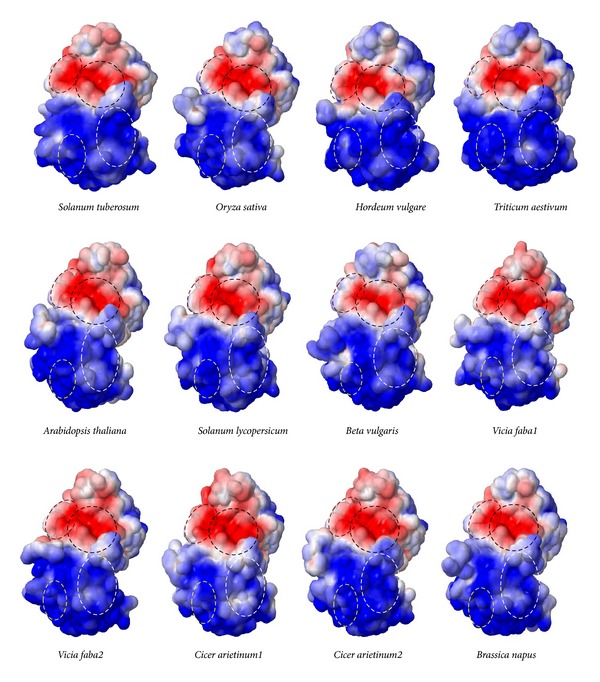
Figure 7.

The electrostatic surface potential (generated with APBS) of monocot and dicot AGPase SS along with their structural homologue S. tuberosum AGPase SS is shown in Figure 7. Contour level for the electrostatic potential at the solvent-exposed surface is set to −5 (red) and +5 (blue) kT/e. Black, yellow, and red dotted circles represent the 1st, 2nd, and 3rd sulphate binding regions, respectively, and white dotted circle represents the ATP binding region.
